Gene Conservation Laboratory
Managing Bristol Bay Sockeye Salmon Harvests with Genetic Data
Bristol Bay supports the largest sockeye salmon (Oncorhynchus nerka) fishery in the world.
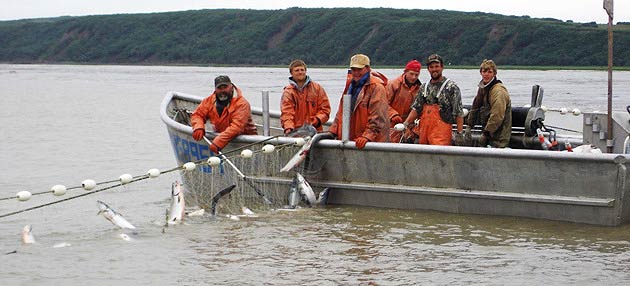 The average harvest from 1989 to 2009 was 25.7 million fish, representing about half of the World's harvest of sockeye salmon. These fish spawn in nine major drainages (stocks) around Bristol Bay, including the Ugashik, Egegik, Naknek, Alagnak, Kvichak, Nushagak, Wood, Igushik, and Togiak rivers. Juveniles live in these freshwater habitats before heading out to sea. A small number of sockeye salmon captured in Bristol Bay are believed to originate in rivers along the North Alaska Peninsula to the south and from Kuskokwim Bay to the north.
Sustained Harvests
The Alaska Department of Fish and Game manages this fishery under the sustained-yield principle. This principle is enshrined in the State's Constitution for the management of all renewable resources in the State. The sustained-yield principle depends on understanding the relationship between the number of fish that "escape" the fishery to spawn and the number of offspring returning to spawn the next generation (stock-recruit relationship). Yield implies economic benefit.
If too few fish escape the fishery, spawning habitats are underused, and this may result in fewer fish for future harvests and lost economic opportunity. If too many fish escape to streams, spawning habitats are over-used and the fishery loses economic opportunities.
Hence, escapement goals are set by a model influenced by spawner density and not just by juvenile density. Maximum sustained yield is possible when escapement is set by this model and not by the strength of an annual run.

Escapements to Bristol Bay spawning areas have varied since 1956 from about 1.7 million fish in 1973 to 38.7 million in 1980. On average, 12.3 million fish spawned in the rivers around Bristol Bay from 1989 to 2009. The number of offspring from these spawners that return to spawn in a drainage (total run) is estimated by adding the number of fish in spawning streams in the drainage (escapement) to the number of fish caught in the harvest that would have otherwise returned to the drainage to spawn (catch).
The drainage of origin for harvested fish must be identified, because escapement estimates are made on a drainage-by-drainage basis. This is especially important because up to 80% of the fish returning to Bristol Bay drainages are harvested.
The numbers of fish "escaping" into drainages in Bristol Bay to spawn are counted from counting towers or from a sonar station. The photo to the left shows a counting tower, where a fishery technician counts sockeye salmon as they swim upstream. Note the solar panel to help run equipment.
Commercial harvests in Bristol Bay are restricted to five fishing districts near the mouths of the nine river drainages. Catches in single-drainage districts, such as the Ugashik, Egegik, and Togiak districts, have been assumed to consist of fish only from those drainages. Catches in the other two districts, which are at the mouths of more than one drainage, are separated using age-of-fish information.
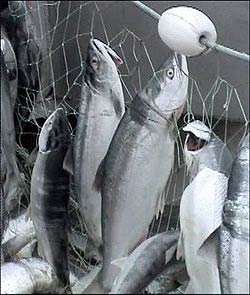
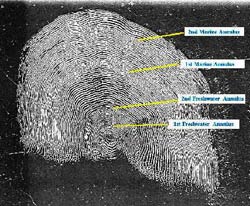
The age-of-fish method is influenced by two sources of error. First, studies using scale-patterns and physical tags show that some non-local-drainage fish are caught in each district. Second, age structure among stocks may be small in some years, leading to errors in estimating stock composition.
Genetic Methods Improve Harvest Management
The challenge to identify the stocks in commercial catches was taken up by the Genetic Conservation Laboratory of the Commercial Fisheries Division of Fish and Game. The use of genetic data to estimate the stock composition of commercial harvests involves three steps. First, a gene-frequency baseline is constructed by sampling tissues from fish in spawning populations that potentially contribute to the fishery and screening these samples for variation with numerous genetic markers. Second, these data are analyzed to determine how genetic variation among spawning aggregates can be used to identify stocks. Third, tissues are collected from fish captured in commercial harvests and genotyped to estimate stock composition.
Population Sampling
The genetic baseline for Bristol Bay sockeye salmon currently includes 96 populations, with multi-year samples for 10 populations.
Sockeye salmon are often very abundant in spawning areas and in many places are easily sampled. The axillary process fin is clipped for DNA extraction and the fish are quickly released.
More about sampling methods (PDF 103 kB).
Labratory Analysis
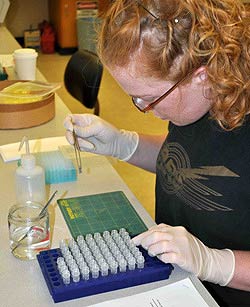
Step 1 DNA is extracted from tissues.

Step 2 A polymerase chain reaction (PCR) assay cocktail and extracted DNA are placed in a 96-well reaction.
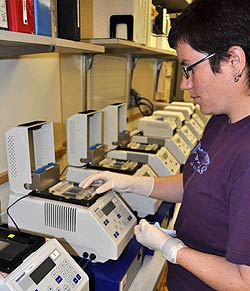
Step 3 Sample extract and assay cocktail are placed in a thermal cycler that amplifies the small fragments of DNA containing single nucleotide polymorphisms (SNPs).
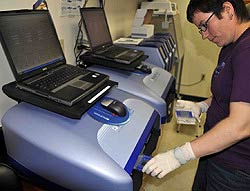
Step 4 When a SNP is present, a dye is released during the PCR process. These reactions are then recorded and captured by a computer for later analysis.

Step 5 A sample of fish will contain homozygotes (two doses of an alleles) for one form of a gene (red), heterozygotes (green), and homozygotes for the other form of the gene (blue). These 'genotypic' data can then be analyzed in various ways to characterize spawning populations.
Read more about labratory techniques
Population Baseline
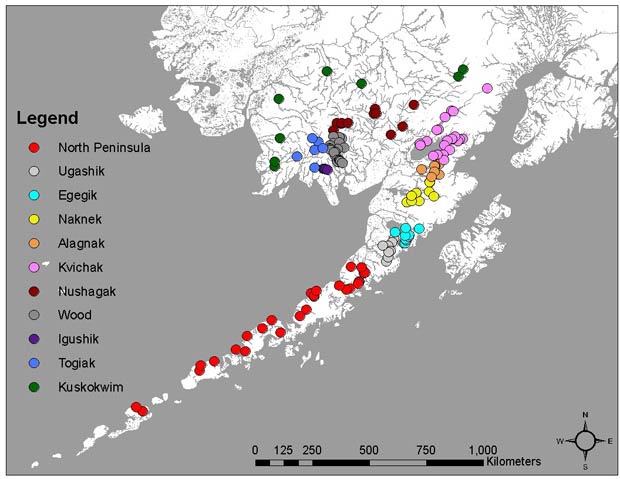
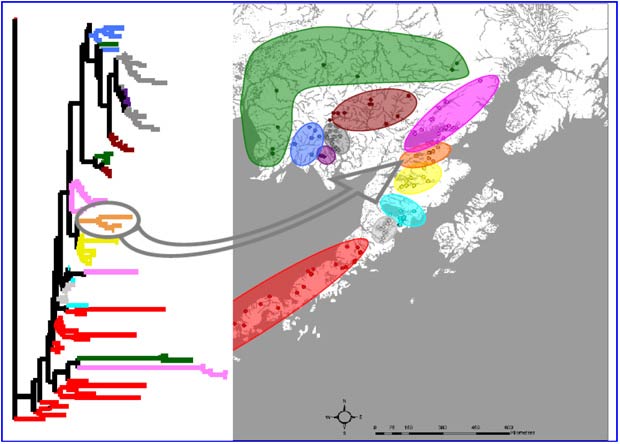
Groups of populations important to fishery management were combined into 11 'reporting groups', consisting of populations in the nine major drainages (various colors), plus populations on the north side of the Alaska Peninsula (red) and populations from Kuskokwim Bay (green).
Samples taken at different times at one place or at different but close sites can be combined to increase the power of tests for genetic structure and the power of mixed-stock analysis, but only if these frequencies are not significantly different. More information (PDF 5,850 kB).
Statistical analysis of population structure
Breeding structure
Several statistical procedures are used to understand the breeding structure of a population. For example, a comparison between observed and expected heterozygosity can indicate whether fish are mating randomly in a spawning area or whether more than one population has been included in a sample. A measure called, "average Heterozygosity" indicates the level of genetic diversity in a population and whether a population has experienced a small population size in the past (bottleneck).
Population structure
Measures of 'population structure' indicate how populations are genetically related to one another. A commonly used statistic is FST , which measures the amount of divergence between populations. A more detailed analysis of population structure consisted of a 3-level Analysis of Variance (ANOVA) to partition sources of gene-frequency variation among samples.
Mixed-stock analysis (MSA)
The stock composition in fishery samples was estimated with Bayesian, Markov Chain Monte Carlo (MCMC) methods. A Bayesian approach is used to account for sample errors and for errors in estimating gene frequencies in the spawning populations. Bayesian methods can also improve the accuracies of mixed-stock analyses by using 'prior' information about the possible stock composition to test against the observed data.
Comparing age-of-fish method and genetic method for estimating the origins of fish in harvest areas
The following three examples illustrate the improvement in accuracy that genetic methods can provide over the traditional use of age composition to estimate stock origins of fish in harvests. An important result of the mixed-stock analysis is that few, if any, fish originating from the east side of Bristol Bay were observed in the Westside fishery, but also the other direction.
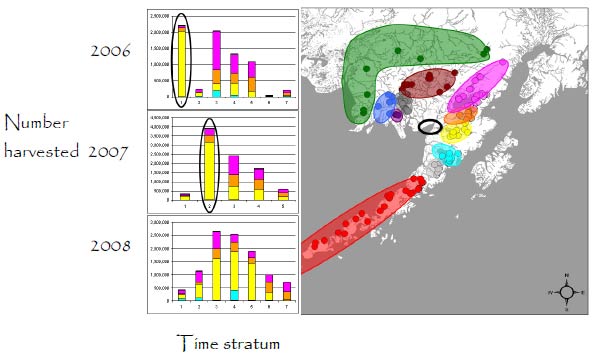
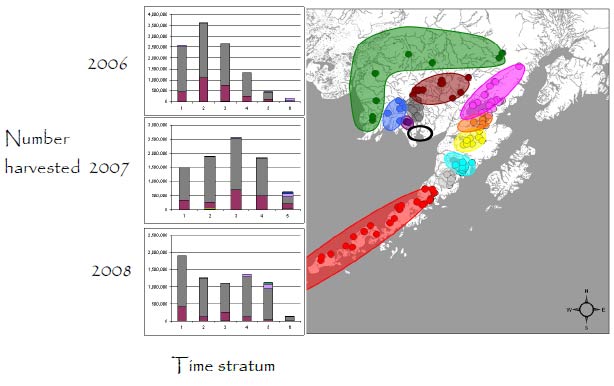
Egegik Fishing District
Within district: Mixed-stock analysis showed that in 2006 fish were mostly from the Egegik River (85.9%), but also from other rivers, including the Ugashik (7.6%), Kvichak (3.0%), Naknek (2.2%), and Wood (0.6%) rivers. The proportion of Egegik River fish in the harvest varied from a high of 97.1% early in the fishing season to a low of 50.2% later in the season. In 2007, fish from other rivers were also harvested in the Egegik District, but overall 77% of the catch were Egegik fish. In 2008, the harvest peaked earlier, with a substantial proportion of fish from other rivers. The bars in ovals show the effects of fishery management restrictions on the stock composition of the harvest. The harvest of non-local stocks declined when fishing was restricted to the Egegik River Special harvest area (ERSHA) in 2006 and 2007 (ovals).
Total inshore run: The age-of-fish method estimates were 7% larger in 2006, 5% larger in 2007, and 14% larger in 2008 than the genetic estimates. These estimates differ from MSA estimates above, because the age-of-fish method assumed that all the fish caught in the Egegik District were from the Egegik River.
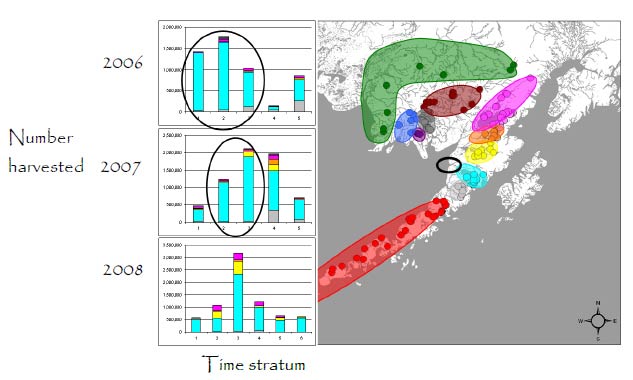
Naknek-Kvichak Fishing District
Within district: Mixed-stock analysis indicated that the stock composition differed from year to year. In all three years, fish were mostly from rivers draining into the District (Naknek, Kvichak and Alagnak rivers), but stock composition shifted between years. In 2006, 40.3% of the harvested fish were bound for the Naknek River. But the proportion increased to 54.2% in 2007 and to 53.5% in 2008. The rest of the catch consisted of Kvichak (25%) and Alagnak (20%) river fish. However, in 2006 the Kvichak contribution (34.8%) was larger than in the other years. In 2006 and 2007, harvests were initially limited to the Naknek River . This explains the large Naknek-River contributions at these times (ovals on graphs). In 2008, this management strategy was not used. In-river harvest areas effectively minimize the harvest of Kvichak River fish.
Total inshore run: Genetic methods appeared to provide more accurate estimates of the total run. The traditional inshore run of Naknek-River fish, estimated by age composition, was 8% larger in 2006, 5% larger in 2007, and 30% smaller in 2008 than for genetic estimates. The inshore run to the Alagnak River spawning areas, estimated by age composition, was 13% smaller in 2006, 3% smaller in 2007, but 41% larger in 2008 than the corresponding genetic estimates for these years. The inshore run for the Kvichak River, estimated by age composition, was 1% smaller in 2006, 21% smaller in 2007, and 5% smaller in 2008 than the corresponding genetic estimates. The large differences between estimates of the inshore runs to the Naknek and Alagnak rivers in 2008 was most likely due to misallocations resulting from low contrasts between the ages of fish in these stocks.
Nushagak Fishing District
In 2006-2008, most harvested sockeye salmon returned to the Wood and Nushagak rivers. Most of these fish were bound for the Wood River (about 75% in all three years), with the remainder returning to the Nushagak (~20%) and Igushik (~3%) rivers. Other stocks contributed only small numbers of fish to this harvest. In general, the age-composition method of allocating the catch underestimated the productivity of the Wood River stock and greatly overestimated the productivity of the Igushik River stock because of the similarities in age at maturity for fish in the two stocks.
Further reading about sockeye salmon around Bristol Bay
Dann, TH and others. 2009 Genetic stock composition of the commercial harvest of sockeye salmon in Bristol Bay, Alaska, 2006-2008 (PDF 5,580 kB). Alaska Department of Fish and Game, Fishery Manuscript Series No. 09-06, Anchorage.
Blair, GR and others. 1993 Variation in life history characteristics and morphology of sockeye salmon in the Kvichak River system, Bristol Bay, Alaska. Transactions of the American Fisheries Society 122:550-559.
Habicht, C and others. 2007 Genetic and ecological divergence defines population structure of sockeye salmon populations returning to Bristol Bay, Alaska, and provides a tool for admixture analysis. Transactions of the American Fisheries Society 136:82-94.
Hamon, TR and others. 2000 Selection on the morphology of spawning wild sockeye salmon by a gill-net fishery. Transactions of the American Fisheries Society 129:1300-1315.
Lin, J and others. 2008 Fine-scale differentiation between sockeye salmon ecotypes and the effect of phenotype on straying. Heredity 101:341-350.
Martinson, EC and others. 2008 Growth and survival of sockeye salmon (Oncorhynchus nerka) from Karluk Lake and River, Alaska, in relation to climatic and oceanic regimes and indices, 1922-2000. Fishery Bulletin US 107:488-500.
Quinn, TP and others. 2001 Balancing natural and sexual selecton in sockeye salmon: interac-tions between body size, reproductive opportunity and vulnerability to predation by bears. Evolutionary Ecology Research 3:917-937.
Schindler , DEand others. 2010 Population diversity and the portfolio effect in an exploited species. Nature 465:609-612.