Variability in Age Estimates
Last modified on Aug 15, 2022
Variability in age estimates was measured by the standard deviation (SD) of scale age estimates for 6,107 scales read by 10 people.
We examined whether SD of age estimates varied by median marine age, stock, year, and length residual (the difference between a fish's length and the median length for that marine age and stock. There were many fish where all readers agreed (CV = 0). The variability data was not normally distributed, so common methods used to compare groups was not possible. Instead, we used zero inflated beta regression and model predictive accuracies to examine whether SD of age estimates varied among groups (Cribari-Neto and Zeileis 2010; Ospina and Ferrari 2010; Spanos 1999). Variables that contributed to variability in age estimates were marine age and absolute value of length residual. Variables that did not explain variability of age estimates were time and stock.
Fish age
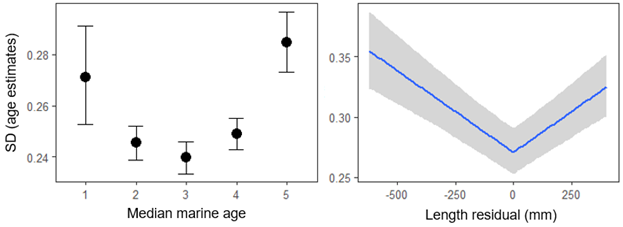
Variability in age estimates was highest for the youngest and oldest marine ages (1 and 5; Figure 1). Variability in age estimates was lowest for common ages, fish that spent two, three, or four years at sea.
Difference in length
The greater the difference between the actual fish length and the median fish length for that age and stock, the greater the variation in age estimates (Figure 1). This means length knowledge or difference in growth patterns from those typical of an age contribute to variability in age estimates.
Stock
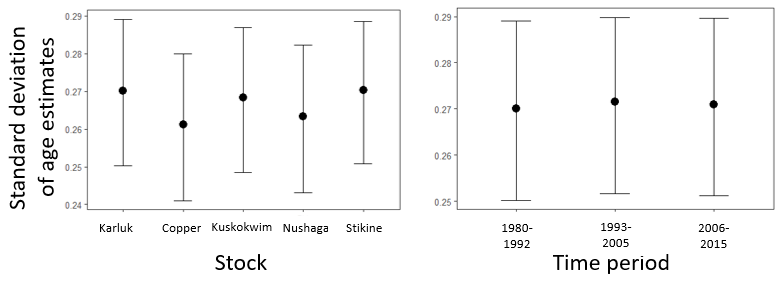
Stock did not significantly contribute to variability in age estimates. Chinook salmon scales sampled from Copper River had slightly lower variability than those from the Nushagak, which had slightly lower variability than those from the Karluk, Kuskokwim, and Stikine (Figure 2).
Time
There were no differences in variability in age estimates among three time periods, older (1980-1992), middle (1993-2005), and recent years (2006-2015; Figure 2).