Gene Conservation Laboratory
Single Nucleotide Polymorphism (SNP) Analysis
Analysis of SNP DNA is performed using the Fluidigm Biomark™ HD system for imaging microarrays in real time quantitative polymerase chain reaction (qPCR). Each of the plotted points in this photo represents a single SNP genotype for a sample. ABIs Taqman Fluorescent chemistry allows for genotyping without post PCR modification of amplified product or electrophoresis, a major advantage over microsatellites and sequencing.
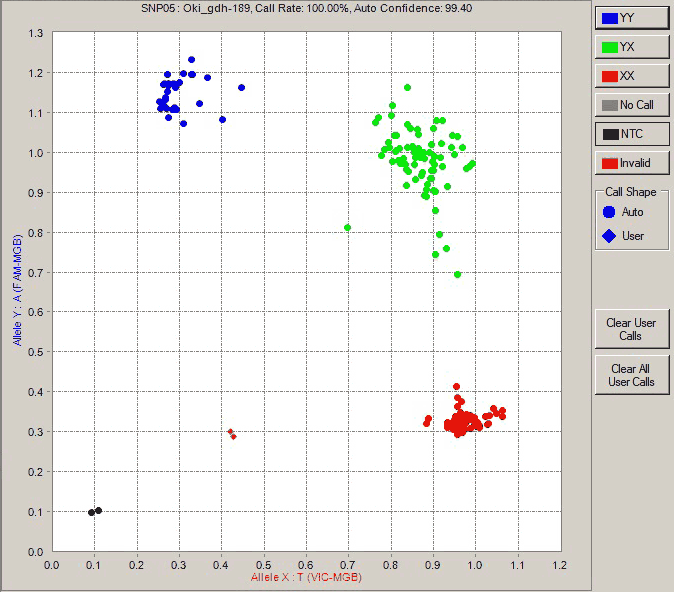
The Fluidigm genotyping software helps to determine genotype clusters results from the fluorescent decomposition of PCR. This system can let us see outliers that should not be included in analysis (orange diamond points) and how allele amplification is relative to our control (black round points).

The microarrays are loaded into the Biomark HD imager. After samples are automatically loaded into imager they undergo detection of fluorescence, and computer analysis. One chip is processed every three minutes.