
Commercial Herring Fisheries
Southeast Alaska & Yakutat
Recorded Announcements: For recorded fishery information in Southeast Alaska please see the Southeast Contacts page.
Fishery Advisory Announcements
- 2026 Southeast Alaska Herring Summary (PDF 283 kB) - 6/2/26
- Sitka Sound Herring Fishery Summary (PDF 541 kB) - 4/30/26
- 2026 Ketchikan Herring Fishery Update # 16 (PDF 407 kB) - 4/10/26
- Sitka Sound Herring Fishery Update # 23 (PDF 488 kB) - 4/10/26
- Sitka Sound Herring Fishery Announcement (PDF 257 kB) - 4/10/26
- 2026 Ketchikan Herring Fishery Update # 15 (PDF 472 kB) - 4/9/26
- Sitka Sound Herring Fishery Update # 22 (PDF 264 kB) - 4/9/26
- Sitka Sound Herring Fishery Update # 21 (PDF 264 kB) - 4/8/26
- 2026 Ketchikan Fishery Update # 14 (PDF 476 kB) - 4/8/26
- 2026 Ketchikan Herring Fishery Update # 13 (PDF 427 kB) - 4/7/26
- Sitka Sound Herring Fishery Update # 20 (PDF 264 kB) - 4/7/26
- Sitka Sound Herring Fishery Update # 19 (PDF 486 kB) - 4/6/26
- 2026 Ketchikan Herring Fishery Update # 12 (PDF 598 kB) - 4/5/26
- Sitka Sound Herring Fishery Update # 18 (PDF 485 kB) - 4/5/26
- Sitka Sound Herring Fishery Announcement (PDF 535 kB) - 4/4/26
- Sitka Sound Herring Fishery Update # 17 (PDF 503 kB) - 4/4/26
- 2026 Ketchikan Herring Fishery Update # 12 (PDF 557 kB) - 4/4/26
- 2026 Ketchikan Herring Fishery Update # 11 (PDF 277 kB) - 4/3/26
- Sitka Sound Herring Fishery Update # 16 (PDF 497 kB) - 4/3/26
- 2026 Ketchikan Herring Fishery Update # 10 (PDF 276 kB) - 4/2/26
- Sitka Sound Herring Fishery Update # 15 (PDF 802 kB) - 4/2/26
- 2026 Ketchikan Herring Fishery Update # 9 (PDF 276 kB) - 4/1/26
- Sitka Sound Herring Fishery Update # 14 (PDF 735 kB) - 4/1/26
- 2026 Ketchikan Herring Fishery Update # 8 (PDF 275 kB) - 3/31/26
- Sitka Sound Herring Fishery Update # 13 (PDF 737 kB) - 3/31/26
- 2026 Ketchikan Herring Fishery Update # 7 (PDF 273 kB) - 3/30/26
- Sitka Sound Herring Fishery Update # 12 (PDF 706 kB) - 3/30/26
- 2026 Ketchikan Herring Fishery Update # 6 (PDF 275 kB) - 3/29/26
- Sitka Sound Herring Fishery Update # 11 (PDF 798 kB) - 3/29/26
- 2026 Ketchikan Herring Fishery Update # 5 (PDF 274 kB) - 3/28/26
- Sitka Sound Herring Fishery Update # 10 (PDF 528 kB) - 3/28/26
- 2026 Ketchikan Herring Fishery Update # 4 (PDF 271 kB) - 3/27/26
- Sitka Sound Herring Fishery Update # 9 (PDF 522 kB) - 3/27/26
- 2026 Ketchikan Herring Fishery Update # 3 (PDF 269 kB) - 3/26/26
- Sitka Sound Herring Fishery Update # 8 (PDF 267 kB) - 3/26/26
- 2026 Ketchikan Herring Fishery Update # 2 (PDF 265 kB) - 3/25/26
- Sitka Sound Herring Fishery Update # 7 (PDF 264 kB) - 3/25/26
- Sitka Sound Herring Fishery Update # 6 (PDF 268 kB) - 3/24/26
- Sitka Sound Herring Fishery Update # 5 (PDF 268 kB) - 3/23/26
- Sitka Sound Herring Fishery Update # 4 (PDF 267 kB) - 3/22/26
- Sitka Sound Herring Fishery Update # 3 (PDF 270 kB) - 3/20/26
- 2026 Ketchikan Herring Fishery Update # 1 (PDF 272 kB) - 3/20/26
- Sitka Sound Herring Fishery Update # 2 (PDF 264 kB) - 3/18/26
- Sitka Sound Herring Fishery Update # 1 (PDF 262 kB) - 3/16/26
- 2026 Southeast Alaska Herring Spawn-On-Kelp Pound Fisheries (PDF 276 kB) - 3/6/26
- Sitka Sound Herring Fishery Announcement (PDF 265 kB) - 2/23/26
- 2026 Southeast Alaska Eulachon Smelt Fishery Announcement (PDF 454 kB) - 2/13/26
Management
Meetings
Management Plans
2026
- 2026 Southeast Alaska Herring Spawn-On-Kelp Pound Fishery Management Plan (PDF 996 kB)
- 2026 Southeast Alaska Herring Sac Roe Fishery Management Plan (PDF 1,410 kB)
2025
- 2025 Southeast Alaska Herring Spawn-On-Kelp Pound Fishery Management Plan (PDF 1,102 kB)
- 2025 Southeast Alaska Herring Sac Roe Fishery Management Plan (PDF 1,455 kB)
2024
2023
Draft management plans completed but not published.
2022
- 2022 Southeast Alaska Herring Sac Roe Fishery Management Plan (PDF 1,334 kB)
- 2022 Southeast Alaska Herring Spawn-On-Kelp Pound Fishery Management Plan (PDF 1,165 kB)
2021
- 2021 Southeast Alaska Herring Sac Roe Fishery Management Plan (PDF 1,301 kB)
- 2021 Southeast Alaska Herring Spawn-On-Kelp Pound Fishery Management Plan (PDF 1,127 kB)
2020
- 2020 Southeast Alaska Sac Roe Herring Fishery Management Plan (PDF 992 kB)
- 2020 Southeast Alaska Herring Spawn-On-Kelp Pound Fishery Management Plan (PDF 1,394 kB)
2019
- 2019 Southeast Alaska Sac Roe Herring Fishery Management Plan (PDF 2,200 kB)
- 2019 Southeast Alaska Herring Spawn-On-Kelp Pound Fishery Management Plan (PDF 947 kB)
2018
- 2018 Southeast Alaska Sac Roe Herring Fishery Management Plan (PDF 2,176 kB)
- 2018 Southeast Alaska Herring Spawn-On-Kelp Pound Fishery Management Plan (PDF 904 kB)
2017
- 2017 Southeast Alaska Sac Roe Herring Fishery Management Plan (PDF 1,063 kB)
- 2017 Southeast Alaska Herring Spawn-On-Kelp Pound Fishery Management Plan (PDF 701 kB)
2016
- 2016 Southeast Alaska Sac Roe Herring Fishery Management Plan (PDF 1,101 kB)
- 2016 Southeast Alaska Herring Spawn-On-Kelp Pound Fishery Management Plan (PDF 1,153 kB)
2015
- 2015 Southeast Alaska Sac Roe Herring Fishery Management Plan (PDF 1,152 kB)
- 2015 Southeast Alaska Herring Spawn-On-Kelp Pound Fishery Management Plan (PDF 1,130 kB)
2014
- 2014 Southeast Alaska Sac Roe Herring Fishery Management Plan (PDF 660 kB)
- 2014 Southeast Alaska Herring Spawn-On-Kelp Pound Fishery Management Plan (PDF 1,037 kB)
2013
- 2013 Southeast Alaska Sac Roe Herring Fishery Management Plan (PDF 877 kB)
- 2013 Southeast Alaska Herring Spawn-On-Kelp Pound Fishery Management Plan (PDF 1,124 kB)
2012
- 2012 Southeast Alaska Sac Roe Herring Fishery Management Plan (PDF 594 kB)
- 2012 Southeast Alaska Herring Spawn-On-Kelp Pound Fishery Management Plan (PDF 963 kB)
2011
- 2011 Southeast Alaska Sac Roe Herring Fishery Management Plan (PDF 333 kB)
- 2011 Southeast Alaska Herring Spawn-On-Kelp Pound Fishery Management Plan (PDF 922 kB)
2010
Harvest
Data on this page may not be the most recent available and may be subject to periodic change without prior notification. For most recent and complete data, and associated metadata, please contact ADF&G staff directly. Any use of or dissemination of the data on this website must credit ADF&G as the source, with a disclaimer that exonerates the department for errors or deficiencies in reproduction, subsequent analysis, or interpretation.
Sitka Seine Sac Roe
A summary of the Sitka Sound herring sac roe fishery, 1979–2023.
| Year | Forecast Biomass (tons) | GHL (tons) | Sac Roe Harvest (tons) | Roe % | Nautical Miles Spawn | Spawning Biomass (tons)a | Total Mature Biomass (tons)a | Exvessel $ Value (millions) |
|---|---|---|---|---|---|---|---|---|
| 1979 | 20,300 | 2,000 | 2,559 | 9.3 | 41.0 | 35,260 | 37,515 | $5.60 |
| 1980 | 39,500 | 4,000 | 4,445 | 10.8 | 63.0 | 46,666 | 51,111 | $2.15 |
| 1981 | 27,000 | 3,000 | 3,506 | 11.0 | 60.0 | 42,557 | 46,063 | $2.38 |
| 1982 | 30,000 | 3,000 | 4,363 | 11.7 | 40.8 | 28,767 | 33,138 | $3.20 |
| 1983 | 32,850 | 5,500 | 5,416 | 11.1 | 68.0 | 36,799 | 42,249 | $5.03 |
| 1984 | 30,504 | 5,000 | 5,830 | 11.1 | 65.0 | 44,257 | 50,087 | $3.73 |
| 1985 | 38,500 | 7,700 | 7,475 | 11.3 | 60.5 | 33,938 | 41,413 | $7.88 |
| 1986 | 30,948 | 5,029 | 5,443 | 11.9 | 51.6 | 27,326 | 32,769 | $7.41 |
| 1987 | 24,750 | 3,600 | 4,216 | 9.9 | 86.0 | 47,679 | 51,895 | $4.40 |
| 1988 | 46,050 | 9,200 | 9,390 | 9.5 | 104.0 | 59,412 | 68,987 | $4.17 |
| 1989 | 58,500 | 11,700 | 11,831 | 9.4 | 65.5 | 33,168 | 45,303 | $1.18 |
| 1990 | 27,200 | 4,150 | 3,804 | 10.6 | 39.1 | 22,939 | 26,743 | $7.95 |
| 1991 | 22,750 | 3,200 | 1,838 | 8.9 | 44.5 | 32,116 | 34,024 | $0.21 |
| 1992 | 23,450 | 3,356 | 5,368 | 9.4 | 72.5 | 50,127 | 55,495 | $1.37 |
| 1993 | 48,500 | 9,700 | 10,186 | 10.7 | 55.3 | 25,906 | 36,092 | $3.48 |
| 1994 | 28,439 | 4,432 | 4,758 | 11.0 | 58.1 | 17,653 | 22,540 | $3.63 |
| 1995 | 19,688 | 2,609 | 2,908 | 11.8 | 37.3 | 29,018 | 31,996 | $3.93 |
| 1996 | 42,264 | 8,144 | 8,144 | 9.6 | 45.6 | 32,512 | 40,761 | $14.35 |
| 1997 | 54,476 | 10,900 | 11,147 | 11.5 | 41.0 | 36,262 | 47,516 | $4.73 |
| 1998 | 39,213 | 6,900 | 6,638 | 10.2 | 64.5 | 44,565 | 51,351 | $1.65 |
| 1999 | 43,602 | 8,476 | 9,217 | 10.7 | 59.5 | 49,847 | 59,268 | $4.91 |
| 2000 | 33,365 | 5,120 | 4,630 | 9.9 | 54.5 | 50,302 | 54,921 | $2.67 |
| 2001 | 52,985 | 10,597 | 11,974 | 11.3 | 61.0 | 53,568 | 65,628 | $5.79 |
| 2002 | 55,209 | 11,042 | 9,788 | 10.9 | 42.6 | 57,505 | 67,441 | $4.44 |
| 2003 | 39,319 | 6,969 | 7,051 | 10.7 | 47.1 | 73,198 | 80,154 | $3.20 |
| 2004 | 53,088 | 10,618 | 10,490 | 10.8 | 79.8 | 92,082 | 102,699 | $5.16 |
| 2005 | 55,962 | 11,192 | 11,366 | 11.5 | 39.5 | 83,447 | 94,967 | $6.12 |
| 2006 | 52,059 | 10,412 | 9,967 | 10.5 | 57.4 | 77,243 | 87,312 | $2.64 |
| 2007 | 59,519 | 11,904 | 11,571 | 11.4 | 50.2 | 81,510 | 93,272 | $5.70 |
| 2008 | 87,715 | 14,723 | 14,386 | 11.5 | 55.3 | 92,131 | 106,691 | $8.90 |
| 2009 | 72,521 | 14,504 | 14,776 | 11.8 | 65.6 | 106,022 | 120,896 | $12.70 |
| 2010 | 91,467 | 18,293 | 17,874 | 12.5 | 87.7 | 98,239 | 116,203 | $12.15 |
| 2011 | 97,449 | 19,490 | 19,419 | 13.3 | 78.3 | 89,066 | 108,605 | $3.96 |
| 2012 | 144,143 | 28,829 | 13,231 | 11.8 | 55.9 | 63,719 | 77,027 | $8.87 |
| 2013 | 76,988 | 11,549 | 5,688 | 13.0 | 61.3 | 68,090 | 73,875 | $4.44 |
| 2014 | 81,663 | 16,333 | 16,957 | 12.4 | 50.0 | 52,899 | 69,976 | $3.05 |
| 2015 | 44,237 | 8,712 | 8,756 | 11.8 | 87.9 | 52,888 | 61,744 | $2.19 |
| 2016 | 74,707 | 14,941 | 9,769 | 10.7 | 63.3 | 61,333 | 71,389 | $2.20 |
| 2017 | 73,245 | 14,649 | 13,923 | 11.4 | 62.3 | 50,417 | 64,480 | $4.29 |
| 2018 | 55,637 | 11,128 | 2,926 | 11.2 | 33.1 | 55,531 | 58,541 | $1.00 |
| 2019 | 64,343 | 12,869 | — | — | 55.8 | 151,711 | 151,711 | — |
| 2020 | 212,330 | 25,824 | — | — | 58.5 | 292,536 | 292,556 | — |
| 2021 | 210,453 | 33,304 | 15,578 | 11.5 | 102.3 | 281,380 | 297,309 | $4.67 |
| 2022 | 225,820 | 45,164 | 25,090 | 11.9 | 91.5 | 201,451 | 226,827 | $7.53 |
| 2023 | 150,617 | 30,124 | 10,199 | 10.8 | 83.8 | 191,300 | 201,753 | $3.06 |
| 2024 | 406,228 | 81,246 | 12,678 | 11.6 | 85.2 | 188,662 | 202,134 | $1.27 |
| 2025 | 183,599 | 36,720 | * | * | * | * | * | * |
a taken from most recent ASA model run available; 2024 not available at this time.
Note - dashes indicate no commercial fishery was conducted and therefore no harvest.
Note - asterisks indicate data is preliminary and not available at this time.
| Season | Hobart/Houghton | Kah Shakes/Cat I. | Seymour Canal | Other (tons) | Total (tons) | ||||||
|---|---|---|---|---|---|---|---|---|---|---|---|
| GHL (tons) |
Harvest (tons) |
Permits | GHL (tons) |
Harvest (tons) |
Permits | GHL | Harvest in tons | Permits | |||
| 1976 | — | — | — | — | 494 | 76 | — | — | — | 283 | 777 |
| 1977 | — | — | — | — | 776 | 106 | — | — | — | 211 | 987 |
| 1978 | — | — | — | — | 171 | 114 | — | — | — | 367 | 538 |
| 1979 | — | — | — | — | 524 | 90 | — | — | — | — | 524 |
| 1980 | — | — | — | — | 1,149 | 112 | — | — | — | — | 1,149 |
| 1981 | — | — | — | — | 1,871 | 111 | 600 | 615 | 98 | — | 2,486 |
| 1982 | — | — | — | — | 2,319 | 116 | — | — | — | — | 2,319 |
| 1983 | — | — | — | — | 3,113 | 122 | — | — | — | 33 | 3,113 |
| 1984 | — | — | — | — | 2,177 | 126 | 375 | 499 | 101 | — | 2,676 |
| 1985 | — | — | — | — | 2,159 | 120 | — | — | — | — | 2,159 |
| 1986 | — | — | — | — | 1,530 | 117 | 300 | 392 | 84 | — | 1,922 |
| 1987 | — | — | — | — | 1,452 | 117 | 400 | 302 | 88 | — | 1,754 |
| 1988 | — | — | — | — | 1,145 | 119 | 534 | 586 | 97 | — | 1,731 |
| 1989 | — | — | — | — | 595 | 85 | 332 | 541 | 103 | — | 1,136 |
| 1990 | — | — | — | — | — | — | 312 | 359 | 70 | — | 359 |
| 1991 | — | — | — | — | 660 | 84 | — | — | — | — | 660 |
| 1992 | — | — | — | — | 1,246 | 113 | — | — | — | — | 1,246 |
| 1993 | — | — | — | — | 737 | 102 | — | — | — | — | 737 |
| 1994 | — | — | — | — | 730 | 118 | 368 | 374 | 95 | — | 1,104 |
| 1995 | — | — | — | — | 610 | 112 | 316 | 319 | 88 | — | 929 |
| 1996 | — | — | — | — | 601 | 121 | — | — | — | — | 601 |
| 1997 | 450 | 442 | 87 | — | 1,159 | 112 | — | — | — | 28 | 1,629 |
| 1998 | 258 | 351 | 53 | — | 616 | 84 | 633 | 585 | 72 | — | 1,552 |
| 1999 | 443 | 506 | 89 | — | — | — | 595 | 706 | 86 | — | 1,212 |
| 2000 | — | — | — | — | — | — | 346 | 389 | 43 | — | 389 |
| 2001 | — | — | — | — | — | — | 474 | 620 | 54 | — | 620 |
| 2002 | — | — | — | — | — | — | 1,096 | 1,066 | 62 | — | 1,066 |
| 2003 | — | — | — | — | — | — | 1,712 | 1,519 | 76 | — | 1,519 |
| 2004 | — | — | — | — | — | — | 838 | 804 | 85 | — | 804 |
| 2005 | 223 | 204 | 48 | — | — | — | 894 | 945 | 61 | — | 1,149 |
| 2006 | — | — | — | — | — | — | 1,508 | 1,187 | 39 | — | 1,187 |
| 2007 | — | — | — | — | — | — | 1,292 | 1,219 | 44 | — | 1,219 |
| 2008 | 462 | 306 | 59 | — | — | — | 1,205 | 1,208 | 60 | — | 1,514 |
| 2009 | 341 | 341 | 62 | — | — | — | 1,471 | 866 | 73 | — | 1,207 |
| 2010 | 345 | 302 | 47 | — | — | — | 657 | 710 | 54 | — | 1,012 |
| 2011 | — | — | — | — | — | — | 835 | c | c | — | c |
| 2012d | — | — | — | — | — | — | 1,287 | 0 | 0 | — | 0 |
| 2013 | — | — | — | — | — | — | 1,014 | 649 | 51 | — | 649 |
| 2014 | — | — | — | — | — | — | 772 | c | c | — | c |
| 2015 | — | — | — | — | — | — | — | — | — | — | — |
| 2016 | — | — | — | — | — | — | — | — | — | — | — |
| 2017 | — | — | — | — | — | — | — | — | — | — | — |
| 2018 | — | — | — | — | — | — | — | — | — | — | — |
| 2019 | — | — | — | — | — | — | — | — | — | — | — |
| 2020 | — | — | — | — | — | — | — | — | — | — | — |
| 2021 | — | — | — | — | — | — | — | — | — | — | — |
| 2022 | — | — | — | — | — | — | — | — | — | — | — |
| 2023 | — | — | — | — | — | — | — | — | — | — | — |
| 2024 | — | — | — | — | — | — | — | — | — | — | — |
| 2025 | — | — | — | — | — | — | — | — | — | — | — |
c Confidential data.
d Fishery was not opened
Note - dashes indicate no commercial fishery was conducted and therefore no harvest.
Northern Spawn on Kelp
A historical summary of northern Southeast herring spawn-on-kelp (SOK) fisheries and total regional harvests and values, 1990–2018.
Hoonah Sound
| Year | Herring GHL (tons) | SOK Harvest (tons) | Permit Holders Landing | Fishery Exvessel Value |
|---|---|---|---|---|
| 1990 | 150 | 12 | 99 | $201,348 |
| 1991 | 150 | 13.6 | 83 | $193,715 |
| 1992 | 150 | 23.1 | 108 | $453,152 |
| 1993 | 150 | 14.8 | 64 | $542,080 |
| 1994 | 150 | 33.3 | 110 | $1,683,396 |
| 1995 | 150 | 28.7 | 125 | $1,175,460 |
| 1996 | — | — | — | — |
| 1997 | 1,421 | 64.3 | 125 | $920,000 |
| 1998 | 700 | 85.6 | 115 | $1,000,000 |
| 1999 | 778 | 93.8 | 86 | $1,005,529 |
| 2000 | 359 | 36 | 84 | $587,568 |
| 2001 | 366 | 66.2 | 87 | $1,005,997 |
| 2002 | 1,264 | 136.6 | 98 | $2,000,000 |
| 2003 | 427 | 141.6 | 108 | $1,929,286 |
| 2004 | 1,207 | 236.1 | 107 | $2,071,347 |
| 2005 | 728 | 181.7 | 94 | $1,117,568 |
| 2006 | 669 | 162.1 | 79 | $1,943,422 |
| 2007 | 681 | 159.4 | 91 | $4,491,071 |
| 2008 | 2,238 | 228.1 | 101 | $5,221,568 |
| 2009 | 2,238 | 234.7 | 101 | $2,332,514 |
| 2010 | 3,182 | 290.4 | 101 | $2,580,517 |
| 2011 | 3,015 | 193.7 | 89 | $1,820,952 |
| 2012 | 2,139 | 186.5 | 73 | $4,033,078 |
| 2013 | 130 | 0 | 0 | $– |
| 2014 | — | — | — | — |
| 2015 | — | — | — | — |
| 2016 | — | — | — | — |
| 2017 | — | — | — | — |
| 2018 | — | — | — | — |
| 2019 | — | — | — | — |
| 2020 | — | — | — | — |
| 2021 | — | — | — | — |
| 2022 | — | — | — | — |
| 2023 | — | — | — | — |
| 2024 | — | — | — | — |
| 2025 | — | — | — | — |
Note - dashes indicate no commercial fishery was conducted and therefore no harvest.
Tenakee Inlet
| Year | Herring GHL (tons) | Herring GHL for SOK | SOK Harvest (tons) | Permit Holders Landing | Fishery Exvessel Value |
|---|---|---|---|---|---|
| 1990 | f | f | f | f | f |
| 1991 | f | f | f | f | f |
| 1992 | f | f | f | f | f |
| 1993 | f | f | f | f | f |
| 1994 | f | f | f | f | f |
| 1995 | f | f | f | f | f |
| 1996 | f | f | f | f | f |
| 1997 | f | f | f | f | f |
| 1998 | f | f | f | f | f |
| 1999 | f | f | f | f | f |
| 2000 | f | f | f | f | f |
| 2001 | f | f | f | f | f |
| 2002 | f | f | f | f | f |
| 2003 | 528 | 180 | 47.6 | 59 | $580,500 |
| 2004 | 399 | 360 | 98.7 | 85 | $891,000 |
| 2005 | 476 | 476 | 93.7 | 91 | $512,900 |
| 2006 | — | — | — | — | — |
| 2007 | — | — | — | — | — |
| 2008 | — | — | — | — | — |
| 2009 | 875 | 621 | 64.1 | 83 | $558,900 |
| 2010 | 583 | 58e | 0 | — | — |
| 2011 | — | — | — | — | — |
| 2012 | — | — | — | — | — |
| 2013 | — | — | — | — | — |
| 2014 | 501 | 272 | 84.4 | 71 | $1,155,300 |
| 2015 | — | — | — | — | — |
| 2016 | — | — | — | — | — |
| 2017 | — | — | — | — | — |
| 2018 | — | — | — | — | — |
| 2019 | — | — | — | — | — |
| 2020 | — | — | — | — | — |
| 2021 | — | — | — | — | — |
| 2022 | — | — | — | — | — |
| 2023 | — | — | — | — | — |
| 2024 | — | — | — | — | — |
| 2025 | — | — | — | — | — |
e At SOK GHL <100 tons, only open pounds allowed
f Tenakee Inlet SOK fishery was established by the Board of Fisheries (BOF) in 2003.
Note - dashes indicate no commercial fishery was conducted and therefore no harvest.
Southeast Alaska
Northern Southeast Alaska (NSEAK) Total SOK
| Year | SOK Harvest (tons) | Fishery Exvessel Value |
|---|---|---|
| 1990 | 12 | $201,348 |
| 1991 | 13.6 | $193,715 |
| 1992 | 23.1 | $453,152 |
| 1993 | 14.8 | $542,080 |
| 1994 | 33.3 | $1,683,396 |
| 1995 | 28.7 | $1,175,460 |
| 1996 | — | — |
| 1997 | 64.3 | $920,000 |
| 1998 | 85.6 | $1,000,000 |
| 1999 | 93.8 | $1,005,529 |
| 2000 | 36 | $587,568 |
| 2001 | 66.2 | $1,005,997 |
| 2002 | 136.6 | $2,000,000 |
| 2003 | 189.2 | $2,509,786 |
| 2004 | 334.8 | $2,962,347 |
| 2005 | 275.4 | $1,630,468 |
| 2006 | 162.1 | $1,943,422 |
| 2007 | 159.4 | $4,491,071 |
| 2008 | 228.1 | $5,221,568 |
| 2009 | 298.8 | $2,891,414 |
| 2010 | 290.4 | $2,580,517 |
| 2011 | 193.7 | $1,820,952 |
| 2012 | 186.5 | $4,033,078 |
| 2013 | 0 | $0 |
| 2014 | 84.4 | — |
| 2015 | — | — |
| 2016 | — | — |
| 2017 | — | — |
| 2018 | — | — |
| 2019 | — | — |
| 2020 | — | — |
| 2021 | — | — |
| 2022 | — | — |
| 2023 | — | — |
| 2024 | — | — |
| 2025 | — | — |
Note - dashes indicate no commercial fishery was conducted and therefore no harvest.
Southern Spawn on Kelp
Craig – Klawock
| Year | Herring GHL (tons) | Herring GHL for SOK | SOK Harvest (tons) | Permit Holders Landing | Fishery Exvessel Value |
|---|---|---|---|---|---|
| 1992 | 2,684 | 403 | 25.7 | 227 | $180,000 |
| 1993 | 1,602 | 240 | 5.3 | 21 | $47,882 |
| 1994 | 895 | 135 | 16.8 | 84 | $364,199 |
| 1995 | 725 | 109 | 25.4 | 146 | $1,000,000 |
| 1996 | 658 | 100 | 37.6 | 154 | $1,490,000 |
| 1997 | 715 | 200 | 21.9 | 143 | $270,306 |
| 1998 | 755 | 500 | 23.5 | 148 | $152,203 |
| 1999 | 750 | 650 | 36 | 103 | $212,121 |
| 2000 | 626 | 280 | 0 | 0 | $0 |
| 2001 | 1,058 | 914 | 26.9 | 51 | $146,859 |
| 2002 | 952 | 852 | 41.7 | 89 | $218,700 |
| 2003 | 630 | 528 | 69.2 | 118 | $423,000 |
| 2004 | 1,754 | 1,579 | 49.3 | 95 | $325,000 |
| 2005 | 2,217 | 1,667 | 118.2 | 70 | $603,723 |
| 2006 | 1,955 | 1,266 | 29 | 34 | $298,575 |
| 2007 | 1,860 | 1,284 | 44.5 | 47 | $1,087,532 |
| 2008 | 1,945 | 1,380 | 148.5 | 122 | $3,066,788 |
| 2009 | 1,945 | 1,802 | 137.3 | 137 | $1,256,777 |
| 2010 | 2,074 | 1,953 | 116.7 | 107 | $884,715 |
| 2011 | 1,901 | 1,084 | 70 | 52 | $728,147 |
| 2012 | 6,847 | 6,536 | 98.2 | 64 | $2,099,002 |
| 2013 | 4,060 | 3,751 | 137.7 | 131 | $3,099,002 |
| 2014 | 4,808 | g | g | 138 | g |
| 2015 | 2,263 | 1,367 | g | 133 | g |
| 2016 | 1,590 | 692 | g | 129 | g |
| 2017 | 872 | 349 | 70.0 | 116 | 932,917 |
| 2018 | 2,312 | 1,602 | 205.3 | 132 | 3,262,900 |
| 2019 | 3,906 | 2,898 | 202.1 | 140 | 3,293,443 |
| 2020 | 11,014 | 10,119 | 283.9 | 147 | 3,253,494 |
| 2021 | 19,456 | 18,916 | 262.0 | 139 | 2,150,000 |
| 2022 | 12,650 | 12,252 | 193.5 | 119 | 2,437,900 |
| 2023 | 7,761 | 7,078 | 127.8 | 79 | 1,950,000 |
| 2024 | 6,716 | g | 92.8 | 60 | 2,117,000 |
| 2025 | 6,036 | * | * | * | * |
g Confidential Information
Note - asterisks indicate data is preliminary and not available at this time.
Ernest Sound
| Year | Herring GHL (tons) | Herring GHL for SOK | SOK Harvest (tons) | Permit Holders Landing | Fishery Exvessel Value |
|---|---|---|---|---|---|
| 1992 | h | h | h | h | h |
| 1993 | h | h | h | h | h |
| 1994 | h | h | h | h | h |
| 1995 | h | h | h | h | h |
| 1996 | h | h | h | h | h |
| 1997 | h | h | h | h | h |
| 1998 | h | h | h | h | h |
| 1999 | h | h | h | h | h |
| 2000 | h | h | h | h | h |
| 2001 | h | h | h | h | h |
| 2002 | h | h | h | h | h |
| 2003 | h | h | h | h | h |
| 2004 | 875 | 831 | 56.1 | 64 | $370,544 |
| 2005 | — | — | — | — | — |
| 2006 | — | — | — | — | — |
| 2007 | — | — | — | — | — |
| 2008 | 1,382 | 700 | 9.8 | 13 | $202,395 |
| 2009 | 476 | 300 | 2.5 | 4 | $24,423 |
| 2010 | 297 | — | — | — | — |
| 2011 | 613 | 100-299 | 0 | 0 | 0 |
| 2012 | 272 | — | — | — | — |
| 2013 | 341 | 100-299 | 64.6 | 81 | $1,574,307 |
| 2014 | 1,073 | 700 + | i | 129 | i |
| 2015 | — | — | — | — | — |
| 2016 | — | — | — | — | — |
| 2017 | — | — | — | — | — |
| 2018 | — | — | — | — | — |
| 2019 | — | — | — | — | — |
| 2020 | — | — | — | — | — |
| 2021 | — | — | — | — | — |
| 2022 | — | — | — | — | — |
| 2023 | — | — | — | — | — |
| 2024 | — | — | — | — | — |
| 2025 | — | — | — | — | — |
h The Ernest Sound SOK fishery was established by the Board of Fisheries (BOF) in 2003. The fishery first took place in 2004.
i Confidential data.
Note - dashes indicate no commercial fishery was conducted and therefore no harvest.
Southern Southeast Alaska Totak SOK
| Year | SOK Harvest (tons) | Fishery Exvessel Value |
|---|---|---|
| 1992 | 25.7 | $180,000 |
| 1993 | 5.3 | $47,882 |
| 1994 | 16.8 | $364,199 |
| 1995 | 25.4 | $1,000,000 |
| 1996 | 37.6 | $1,490,000 |
| 1997 | 21.9 | $270,306 |
| 1998 | 23.5 | $152,203 |
| 1999 | 36 | $212,121 |
| 2000 | 0 | $0 |
| 2001 | 26.9 | $146,859 |
| 2002 | 41.7 | $218,700 |
| 2003 | 69.2 | $423,000 |
| 2004 | 105.4 | $325,105 |
| 2005 | 118.2 | $603,723 |
| 2006 | 29 | $298,575 |
| 2007 | 44.5 | $1,087,532 |
| 2008 | 158.3 | $3,066,946 |
| 2009 | 139.8 | $1,256,917 |
| 2010 | 116.7 | $884,715 |
| 2011 | 70 | $728,147 |
| 2012 | 98.2 | $2,099,002 |
| 2013 | 202.3 | $3,099,204 |
| 2014 | j | j |
| 2015 | j | j |
| 2016 | j | j |
| 2017 | 70 | 932,917 |
| 2018 | 205.3 | 3,262,900 |
| 2019 | 202.1 | 3,293,443 |
| 2020 | 283.6 | 3,253,494 |
| 2021 | 262 | 2,150,000 |
| 2022 | 193.5 | 2,437,900 |
| 2023 | 127.8 | 1,950,000 |
| 2024 | 92.8 | 2,117,000 |
| 2025 | * | * |
j Confidential data.
Note - asterisks indicate data is preliminary and not available at this time.
Forecasts
- 2024/25 Craig/Klawock Winter Food and Bait Herring GHL (PDF 108 kB)
- 2025 Sitka Sound Herring Fishery Announcement (PDF 128 kB)
- 2024/25 Southeast Alaska Herring Winter Food and Bait Fishery (PDF 130 kB)
- 2024/25 Craig/Klawock Winter Food and Bait Herring GHL ( 108 kB)
- 2023/24 Southeast Alaska Herring Winter Food and Bait Fishery (PDF 126 kB)
- 2023/24 Craig/Klawock Winter Food and Bait Herring GHL ( 127 kB)
- 2023 Sitka Sound Herring Fishery Announcement (PDF 128 kB)
- 2023 Sitka Sound Herring Fishery Announcement (PDF 128 kB)
- 2022/23 Southeast Alaska Herring Winter Food and Bait Fishery (PDF 128 kB)
- 2022 Sitka Sac Roe Herring Fishery Forecast (PDF 125 kB)
- 2022 Spawn-on-kelp and Winter Food and Bait Fisheries Forecasts (PDF 130 kB)
Maps
- Sitka Sound Closed Waters (PDF 725 kB)
- Southeast Alaska Major Herring Stock Locations (PDF 828 kB)
- Active Statewide Herring Fisheries (PDF 892 kB)
- Regulatory Statewide Herring Fisheries (PDF 909 kB)
Interactive Maps
The department piloted the use of a mobile data collection app during Sitka Sound (2020) herring surveys and regionwide in 2021 and continue to use. The interactive maps below allow users to view data collected during herring surveys. Photos if available may be viewed by clicking on the individual features in the map. Spawn features in the survey map are symbolized based on photos and no photos. Herring spawn photos captured during surveys can also be viewed on the 'Photo Viewer' page. Survey data have not been edited and are for reference purposes only. These maps are still under development and feedback is appreciated.
- Southeast Alaska Herring Surveys

The interactive map has multiple pages included: Current day survey, All Surveys (time-enabled showing all 2022 surveys), and 2020 (Sitka Sound) and 2021 SEAK time-enabled apps. Herring spawn photos are highlighted in photo-viewer apps.
Historical Spawn Maps
Video clips depicting the shorelines where herring spawn was observed at several of the prominent herring spawning areas in Southeast Alaska.
Herring Research in Southeast Alaska & Yakutat
General
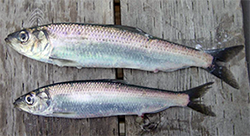
Pacific herring (Clupea pallasii) are widely distributed within the North Pacific Ocean, occurring from Baja California to the Berring Sea and from Sea of Okhotsk to the Yellow Sea. They congregate in schools as juveniles and adults and provide a key link in marine ecosystems between planktonic and predator trophic levels, providing forage for numerous fish, birds, and marine mammals. In Alaska, herring move into shallow waters to spawn in the spring. Herring become mature starting at age 3 or 4, spawning annually throughout their life, living up to 15 years.
Herring are targeted by several fisheries in Southeast Alaska, including those for culturally important subsistence and economically important commercial harvest. Management of fisheries is largely based on the assessment of stocks, defined by spawning areas, to estimate and forecast biomass upon which fishery guideline harvest levels (GHL) are based. A threshold-harvest rate strategy is employed in managing the commercial fishery, wherein a fishery is allowed to open only if the spawning biomass is forecasted to be above the established threshold for any given stock.
Projects
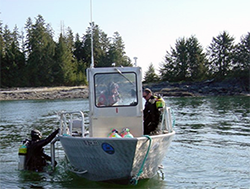
Spawn deposition survey
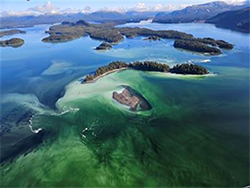
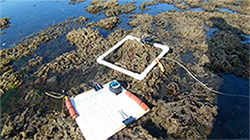
A substantial stock assessment program has been developed to support fishery management in Southeast Alaska. Since 1976 a key part of the assessment has included a survey to estimate herring egg deposition to determine the spawning biomass level. The survey starts with aerial surveys to map spawning locations, which are then used to determine where a SCUBA diving survey will occur to estimate the total number of eggs for each spawning stock. Dive teams survey transects starting at the shallowest location of eggs and ending at the deepest extent of egg observations. Along each transect, a 0.1m2 PVC sampling frame is used to estimate egg density every 5 meters. To help estimate the number of eggs, estimators use a standard reference of 40,000 eggs per single layer of eggs within the sampling frame, which was determined mathematically based on the measurement of egg size.
Results of the egg deposition estimate are input into a stock assessment model (a statistical catch-at-age model or "SCAA") that also uses other data inputs to estimate the spawning biomass and other population metrics such as survival, maturity, age composition, and recruitment. A primary goal of the stock assessment model is to forecast herring spawning biomass for the ensuing year to determine if commercial fisheries will be allowed, and if so, what allowable level and harvest rate will be permitted.
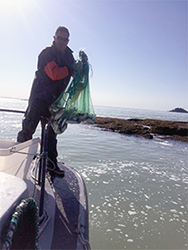
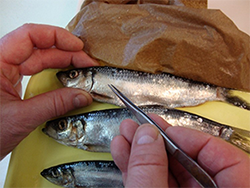
Age and Size Sampling
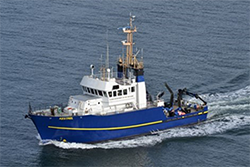
Another important data source for assessing herring stock status comes from sampling adult herring for age and size compositions. Cast nets are used during active spawning to capture and sample adult herring for estimating the age composition of the spawning population. These efforts aim to collect herring throughout the area and the time of the main spawning event, to provide samples that are representative of the spawning population. Samples of adult herring are also collected from the catch of fishing vessels during commercial fisheries, which provide estimates of average herring weight at age and allow estimates of fishery selectivity.
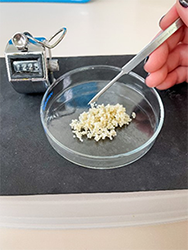
Herring samples are sent to the ADF&G Mark, Tag and Age Laboratory in Juneau for processing. Laboratory staff measure and weigh individual herring and pluck scales to determine age. Herring scales are magnified to count annuli, which depict annual slow winter growth periods and are a measure of years of life. Thousands of scales are processed each year for herring stocks in Southeast Alaska. Estimates of age and size are critical for estimating stock age structure and population status and are important inputs to the SCAA model to estimate and forecast herring biomass.
Other Research
At times, short-term research projects are conducted to help fill information gaps or improve understanding of herring life history. For example, an estimate of herring fecundity (i.e. the number of eggs per female) is important for converting an estimate of eggs to adult herring abundance. Periodically the department has conducted studies to determine average fecundity by sampling herring during spawning events and in the laboratory, estimating the number of eggs. On average, a female herring in Southeast Alaska produces about 20,000 eggs per year.
Publications authored by ADF&G Staff describing stock assessment and research
- Operational Plan: Southeast Alaska Herring Stock Assessment Surveys and Sampling, 2019 (PDF 768 kB)
- Southeast Alaska 2024 Herring Stock Assessment Surveys (PDF 2,896 kB)
- Southeast Alaska 2023 Herring Stock Assessment Surveys (PDF 2,945 kB)
- Southeast Alaska 2022 Herring Stock Assessment Surveys (PDF 2,064 kB)
- Southeast Alaska 2021 Herring Stock Assessment Surveys (PDF 2,476 kB)
- Southeast Alaska 2020 Herring Stock Assessment Surveys (PDF 4,057 kB)
- Southeast Alaska 2019 Herring Stock Assessment Surveys (PDF 12,480 kB)
- Southeast Alaska 2018 Herring Stock Assessment Surveys (PDF 7,788 kB)
- Southeast Alaska 2017 Herring Stock Assessment Surveys (PDF 6,245 kB)
- Southeast Alaska 2016 Herring Stock Assessment Surveys (PDF 7,638 kB)
- Southeast Alaska 2015 Herring Stock Assessment Surveys (PDF 11,604 kB)
- Southeast Alaska 2014 Herring Stock Assessment Surveys (PDF 11,499 kB)
- Southeast Alaska 2013 Herring Stock Assessment Surveys (PDF 7,894 kB)
- Southeast Alaska 2012 Herring Stock Assessment Surveys (PDF 5,194 kB)
- Southeast Alaska 2011 Herring Stock Assessment Surveys (PDF 4,894 kB)
- Southeast Alaska 2010 Herring Stock Assessment Surveys (PDF 5,624 kB)
- Southeast Alaska 2009 Herring Stock Assessment Surveys (PDF 7,864 kB)
- A program for Improving Management and Research of Fisheries in the Southeast Region — Herring (PDF 129 kB)
- Estimation and Evaluation of a Harvest Threshold for Management of the Sitka Herring Sac Roe Fishery Based on a Percentage of Average Unfished Biomass (PDF 642 kB)
![]() Adobe Acrobat PDF files require a free viewer available directly from Adobe.
Adobe Acrobat PDF files require a free viewer available directly from Adobe.