Gene Conservation Laboratory
Bristol Bay Sockeye Salmon Mixed Stock Analysis, Baseline
Populations of sockeye salmon from Bristol Bay, Alaska, support the largest sockeye salmon fishery in the world and the largest valued single salmon fishery in North America. The ADF&G Gene Conservation Laboratory (GCL) provides estimates of stock composition from catch samples to support the harvest management of Bristol Bay sockeye salmon. These estimates require two components: the genetic characterization of all potentially contributing populations (the baseline; this section) and the catch samples from fisheries (the mixtures; see applications and analysis).
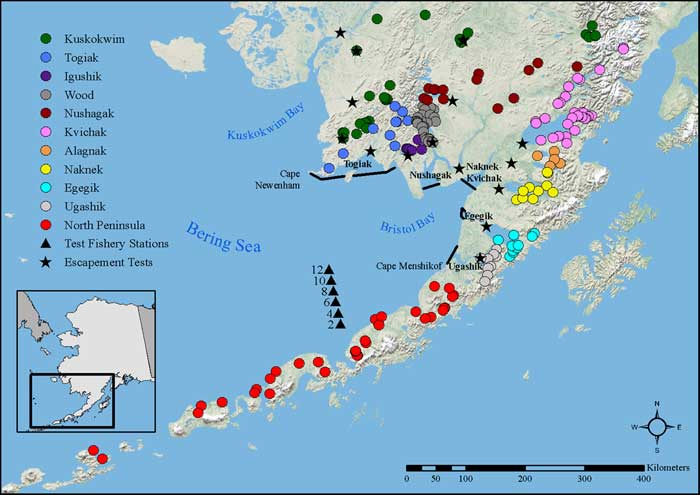
The genetic baseline is assembled by sampling of spawning populations contributing to the fisheries. In Bristol Bay, the baseline has recently increased from 96 populations to 140 distinct populations that range from the Kuskokwim River (to the north) to the Aleutian Islands (to the south) (Figure 1). These baseline fish are genotyped with molecular markers called single nucleotide polymorphisms (SNPs).
Populations are aggregated into "reporting groups" based on management interest, the distribution of genetic variation among spawning populations (Figure 2), and the performance of the mixed-stock analysis (MSA; Figure 3). Reporting groups are the level to which mixtures are allocated during MSA and are referred to as "stocks". In Bristol Bay, these stocks are the 9 major drainages in Bristol Bay and the 2 flanking regions believed to potentially contribute to the fishery. A large amount of effort has gone into sampling and resampling spawning populations in the baseline and genotyping them for 96 SNPs. Based upon these SNPs, populations common to a drainage look more similar to one another than to populations from another drainage. This type of genetic structure works well with MSA. With this new baseline, mixture samples consisting of 190 fish can be confidently assigned to 11 stocks (Figure 1).