Westward Region Research
Mapping Tanner Crab Habitat
Mapping Tanner Crab Habitat
Objectives
Objective:
Collect swath bathymetry and co-registered seafloor acoustic backscatter data in selected areas of annually surveyed Tanner crab habitat northeast of Kodiak Island.

- The 12-day survey took place from May 30 to Jun 10, 2012, using the ADF&G RV Resolution.
- Swath bathyemetry and seafloor acoustic backscatter data was collected using the 160kHz wide-angle sonar seafloor profiler multibeam system WASSP.
- Beams are 4° wide-angle sonar seafloor fore-aft and 120° wide port to starboard. Bottom echoes are captured by a 26-element hydrophonearray.
- Backscatter (harness or bottom echoes) data are corrected for pitch, roll, heave, differential GPS, and directional offsets of the sonar.
- Parallel transects 100-600m wide were run with 60% overlap between adjacent tracks covering approximately 145 km2
RV Resolution

WASSP multibeam sonar program acquiring data during the survey


Maps of the Marmot Bay Study Area Bathymetry and Acoustic Backscatter
- Bathymetry (left) - maximum depths (blue), minimum depths (red)
- Backscatter (right) - hardest substrates (light grey to white), soft substrates (dark grey)


Maps of the Chiniak Bay Study Area Bathymetry and Acoustic Backscatter
- Bathymetry (left) - maximum depths (blue), minimum depths (red)
- Backscatter (right) - hardest substrates (light grey to white), soft substrates (dark grey)
Objective:
Collect high-resolution digital images of the seafloor and associated biota over the same study area.
High resolution digital images were collected by use of ADF&G's Alaska CamSled. CamSled was developed for scallop stock
assessment and has proven useful for fine-scale habitat mapping and other missions (Rosenkranz, 2008).
This was the first opportunity to use CamSled for ground truthing acoustic data.

- Ground truth data was collected by towing the Alaska CamSled behind the RV Resolution during the WASSP multibeam transects.
- There were six CamSled tows in Marmot Bay, covering a total of 51 km.
- There were seven CamSled tows in Chiniak Bay, covering a total of 27 km.
- 293,157 CamSled images were collected and processed.
CamSled and U-Frame on R/V Resolution

In addition to CamSled images, a Ponar grab sampler was used to sample sediment and confirm sediment types as seen in the images or to collect sediment information in areas where the CamSled could not go. The collected sediment was sieved through a series of deck sieves and any animals were collected for later identification.
- 125 sediment samples were taken in Marmot Bay study area.
- 141 sediment samples were taken in Chiniak Bay study area.

Ponar sediment sampler (left)
Video Drop Camera (right)
A video drop camera was used to sample areas where the substrate was too hard to sample with the sediment sampler.
CamSled Images


-- Other Animals and Habitats --


Objective:
Develop methods to process the data collected in (1) and (2) and merge them into habitat maps (the final product) that can be used to improve Tanner crab stock assessment methods. This objective addresses the hypothesis that Tanner crabs prefer distinct habitat types.
Our conceptual approach was to:
- Map specific areas that are important to Tanner crab and are representative habitat of the area.
- Classify the substrate and define the extent of Tanner crab habitat.
- Apply these classifications to habitats in areas not observed by the CamSled.
Surveying with multibeam swath-mapping sonar and groundtruthing the habitat with digital imagery provided a means to classify the substrate and produce a comprehensive map of the habitat types. Bathymetry, bottom slope and rugosity, substrate type, and biological composition and associations were used to develop a catalogue of habitat types.
Corrected Bathymetry and Acoustic Backscatter Data for Chiniak Bay CamSled Tow 6
The acoustic data were processed to extract the bottom depth for about 400 soundings (per ping) across track. Maps are displayed in UTM coordinates with the ship's track superimposed as a thin white line.
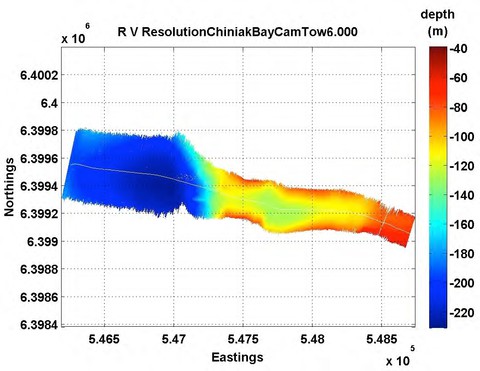
Single swath of bathymetry for Chiniak Bay Tow 6. The track starts on the right.
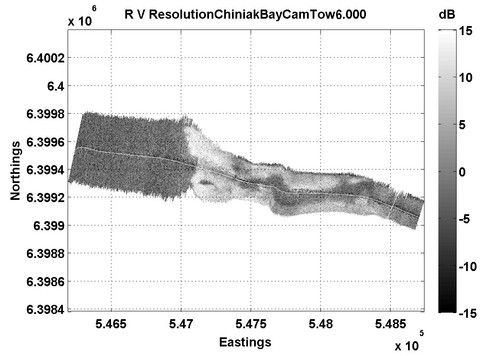
Acoustic backscatter imagery corresponding to the swath for Chiniak Bay Tow 6. Dark regions of the image represent areas of low acoustic backscatter intensity. A trough extends along the track filled with material of lower acoustic impedance (fine grain sediments).
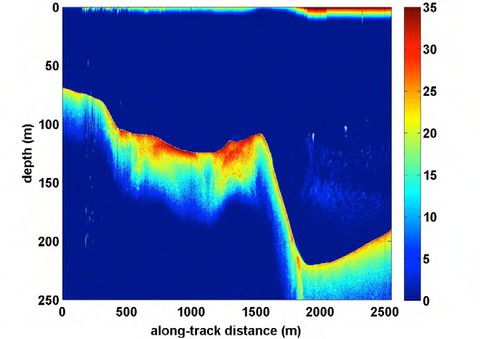
Narrow beam along-track profile of echo intensity. Echo intensity converted to signal-to-noise ratio in dB. The seabed boundary is delineated by the transition from blue to red, starting at about 80 m depth on the left side ending at about 200 m depth on the right. Fish are visible in the water column between 1800 m and 2500 m along-track.
Processing CamSled Images
Images recorded by the CamSled were uploaded into an image database with each image georeferenced and time-stamped.
- Every image was reviewed
- All Tanner crab were counted, measured to the nearest 1 cm, and sexed when possible
- Sediment types was recorded and all species were identified in every 50th image and for every image with a Tanner crab
- Substrates were classified into primary and secondary substrate types
- All fish were speciated and counted
With each image sampled additional characteristics describing habitat were recorded:
- Percentage of of shell hash present
- Percentage of fauna present on substrate
- Evidence of physical processes that affect backscatter data (high current creating sand waves)
- Presence and general size of depressions and mounds
- Number and general size of infauna burrows
- Shrimp species and general size
- Number of anenomes and hermit crabs
- Other things of interest, (i.e., dead crabs, crab pots, animal interactions)
Final Product Goals
- Bathymetry maps covering 100% of the study area.
- Overlay maps of the seafloor features derived from the acoustic backscatter data.
- Detailed maps of Tanner crab habitat and criteria that describe Tanner crab habitat.
- High-quality geo-referenced images of substrate and biota associated with Tanner crabs.
- Habitat database of the survey areas.
- Methodology for mapping and groundtruthing habitat and processing multibeam data allowing continued mapping and improvements to our stock assessment.