Fish Count Data Search
More information for The Copper River escapement estimates is available if you visit the Copper River Commercial Fish salmon fishery page.
|
Location: Copper River (Miles L) |
The selected years are color-coded in the graphs below:
|
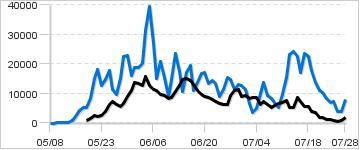
Daily Counts
|
Cumulative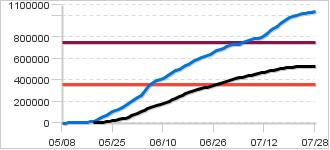
|
|
Description: The Sonar on the Copper River is located at the outlet of Miles Lake, about 70 miles from the Chitina dipnet fishery. It takes approximately 2 weeks for salmon to travel this distance, but this is highly variable depending on the water level. The water levels listed here are an indication of the general trends in the Copper River but may not be indicative of what is occurring at Chitina.
The current escapement goal for Sockeye is 360,000 to 750,000.
Sustainable Escapement Goal for Sockeye in 2019:
360,000 - 750,000
(Graphed above)
|
|
|
Contact:
Fishery Biologist, |
|
81 records returned for the years selected. Dashes indicate days with no count.
[Export results in Excel format or JSON format]
| Date 2020 |
Count 2020 |
Cumulative 2020 |
Cumulative 2019 |
Notes for 2020 |
|---|---|---|---|---|
| Jul-28 | 1,720 | 530,313 | 1,039,354 | last day of operation for season |
| Jul-27 | 1,005 | 528,593 | 1,031,344 | |
| Jul-26 | 596 | 527,588 | 1,027,297 | |
| Jul-25 | 769 | 526,992 | 1,023,499 | |
| Jul-24 | 1,287 | 526,223 | 1,016,161 | |
| Jul-23 | 1,328 | 524,936 | 1,009,254 | |
| Jul-22 | 1,930 | 523,608 | 1,000,932 | |
| Jul-21 | 1,888 | 521,678 | 990,528 | |
| Jul-20 | 3,591 | 519,790 | 979,368 | |
| Jul-19 | 3,897 | 516,199 | 965,604 | |
| Jul-18 | 5,671 | 512,302 | 947,765 | |
| Jul-17 | 5,695 | 506,631 | 925,235 | |
| Jul-16 | 7,230 | 500,936 | 901,783 | |
| Jul-15 | 8,735 | 493,706 | 884,791 | |
| Jul-14 | 5,138 | 484,971 | 862,165 | |
| Jul-13 | 5,411 | 479,833 | 837,949 | |
| Jul-12 | 7,607 | 474,422 | 814,802 | |
| Jul-11 | 7,056 | 466,815 | 799,471 | |
| Jul-10 | 6,681 | 459,759 | 789,919 | |
| Jul-09 | 5,827 | 453,078 | 784,561 | |
| Jul-08 | 5,320 | 447,251 | 777,487 | |
| Jul-07 | 6,266 | 441,931 | 769,351 | |
| Jul-06 | 7,227 | 435,665 | 760,192 | |
| Jul-05 | 6,264 | 428,438 | 746,324 | |
| Jul-04 | 8,648 | 422,174 | 736,220 | |
| Jul-03 | 8,608 | 413,526 | 731,390 | |
| Jul-02 | 8,463 | 404,918 | 727,760 | |
| Jul-01 | 9,349 | 396,455 | 720,991 | |
| Jun-30 | 9,048 | 387,106 | 709,656 | Water Level Reading: 0.00 meters |
| Jun-29 | 11,328 | 378,058 | 696,828 | |
| Jun-28 | 11,043 | 366,730 | 683,622 | |
| Jun-27 | 9,316 | 355,687 | 672,097 | |
| Jun-26 | 6,423 | 346,371 | 657,365 | |
| Jun-25 | 6,387 | 339,948 | 641,790 | |
| Jun-24 | 6,658 | 333,561 | 630,358 | |
| Jun-23 | 7,349 | 326,903 | 621,269 | |
| Jun-22 | 7,964 | 319,554 | 607,940 | |
| Jun-21 | 8,703 | 311,590 | 593,472 | |
| Jun-20 | 8,853 | 302,887 | 580,032 | |
| Jun-19 | 9,520 | 294,034 | 562,895 | |
| Jun-18 | 11,173 | 284,514 | 546,251 | |
| Jun-17 | 13,184 | 273,341 | 532,661 | |
| Jun-16 | 14,512 | 260,157 | 521,541 | |
| Jun-15 | 15,226 | 245,645 | 502,140 | |
| Jun-14 | 14,710 | 230,419 | 484,893 | |
| Jun-13 | 12,576 | 215,709 | 474,272 | |
| Jun-12 | 10,725 | 203,133 | 456,722 | |
| Jun-11 | 8,506 | 192,408 | 433,155 | |
| Jun-10 | 8,433 | 183,902 | 418,530 | |
| Jun-09 | 9,311 | 175,469 | 409,434 | |
| Jun-08 | 9,821 | 166,158 | 394,086 | |
| Jun-07 | 11,080 | 156,337 | 373,104 | |
| Jun-06 | 11,421 | 145,257 | 358,188 | |
| Jun-05 | 12,686 | 133,836 | 331,116 | |
| Jun-04 | 15,696 | 121,150 | 291,684 | |
| Jun-03 | 12,744 | 105,454 | 260,364 | |
| Jun-02 | 13,228 | 92,710 | 240,234 | |
| Jun-01 | 13,753 | 79,482 | 221,436 | |
| May-31 | 11,144 | 65,729 | 202,464 | |
| May-30 | 8,888 | 54,585 | 186,324 | |
| May-29 | 6,640 | 45,697 | 163,421 | |
| May-28 | 5,641 | 39,057 | 140,855 | |
| May-27 | 6,425 | 33,416 | 125,868 | |
| May-26 | 7,187 | 26,991 | 116,069 | |
| May-25 | 6,116 | 19,804 | 104,783 | |
| May-24 | 4,000 | 13,688 | 87,029 | |
| May-23 | 2,631 | 9,688 | 72,348 | |
| May-22 | 2,139 | 7,057 | 59,472 | |
| May-21 | 2,532 | 4,918 | 41,226 | |
| May-20 | 1,623 | 2,386 | 26,093 | please reference USGS for water level https://waterdata.usgs.gov/ak/nwis/uv/?site_no=15214000&PARAmeter_cd=00065,00060 |
| May-19 | 763 | 763 | 17,891 | NB 12 hours of counts, SB 13 hours of counts |
| May-18 | - | - | 12,719 | |
| May-17 | - | - | 7,534 | |
| May-16 | - | - | 3,264 | |
| May-15 | - | - | 1,086 | |
| May-14 | - | - | 372 | |
| May-13 | - | - | 132 | |
| May-12 | - | - | 78 | |
| May-11 | - | - | 12 | |
| May-10 | - | - | 0 | |
| May-08 | - | - | 0 |