Fish Count Data Search
|
Location: Anchor River |
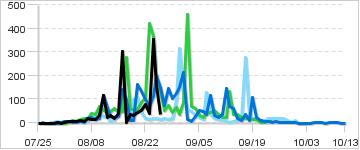
The selected years are color-coded in the graphs below:
|
Daily Counts
|
Cumulative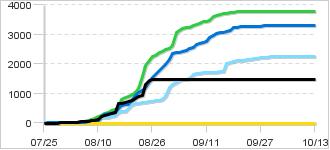
|
|
Description: Weirs are installed on the South and North forks of the Anchor River in early-May to begin monitoring Chinook salmon, coho salmon, and steelhead escapement through the fall. The South fork weir is located at river mile 2.5 and the North fork weir is located at river mile 3.4. Both weirs are located above the salmon sport fishery area, which ends at an ADFG marker approximately 200 yards upstream of the Old Sterling Highway Bridge. An underwater video system is installed within each floating resistance board weir and motion-detected fish passage is recorded 24 hours per day. High spring flows prevent installation of the South Fork floating weir in most years, so a partial fixed-picket weir with
sonar Chinook salmon escapement has been monitored via weirs in the Anchor River since 2003. Escapements have ranged from a low of 2,499 in 2014, to a high of 12,016 in 2004. The Chinook salmon run to the Anchor River begins in May and lasts through early August. Historically, 50% of the Chinook salmon run had passed the weir by June 10, but later run timing in recent years has pushed the 50% date to June 22. The current Chinook salmon sustainable escapement goal is 3,800 – 7,600. Coho salmon escapement in the Anchor River has previously been monitored in the late ‘80s and 2004-2011. Coho salmon escapements ranged from 2,409 to 20,187 in these years. Coho salmon begin entering the Anchor River in late-July and run through September. Run-timing typically peaks in late-August, although it is highly variable and subject to influence by river water levels. There is not currently an escapement goal established for Anchor River coho salmon. Steelhead escapement in the Anchor River has not been fully enumerated, but partial counts of kelts (steelhead emigrating from the system in spring) and immigrating steelhead indicate run sizes are variable and typically small. The most complete fall counts occurred in 1988 and 1992 when 878 and 1,261 fish were counted, respectively. There is not an escapement goal established for Anchor River steelhead.
Sustainable Escapement Goal for Chinook:
3,800 - 7,600
|
|
|
Contact:
Area Manager, |
|
81 records returned for the years selected. Dashes indicate days with no count.
[Export results in Excel format or JSON format]
| Date 2023 |
Count 2023 |
Cumulative 2023 |
Cumulative 2022 |
Cumulative 2021 |
Cumulative 2020 |
Cumulative 2019 |
Notes for 2023 |
|---|---|---|---|---|---|---|---|
| Oct-13 | - | 1,487 | 3,303 | 3,790 | 2,246 | 0 | |
| Oct-12 | - | 1,487 | 3,303 | 3,790 | 2,246 | 0 | |
| Oct-11 | - | 1,487 | 3,303 | 3,790 | 2,246 | 0 | |
| Oct-10 | - | 1,487 | 3,302 | 3,790 | 2,246 | 0 | |
| Oct-09 | - | 1,487 | 3,301 | 3,790 | 2,246 | 0 | |
| Oct-08 | - | 1,487 | 3,298 | 3,790 | 2,246 | 0 | |
| Oct-07 | - | 1,487 | 3,298 | 3,790 | 2,246 | 0 | |
| Oct-06 | - | 1,487 | 3,297 | 3,790 | 2,246 | 0 | |
| Oct-05 | - | 1,487 | 3,296 | 3,790 | 2,246 | 0 | |
| Oct-04 | - | 1,487 | 3,294 | 3,790 | 2,246 | 0 | |
| Oct-03 | - | 1,487 | 3,294 | 3,790 | 2,246 | 0 | |
| Oct-02 | - | 1,487 | 3,294 | 3,790 | 2,246 | 0 | |
| Oct-01 | - | 1,487 | 3,294 | 3,790 | 2,246 | 0 | |
| Sep-30 | - | 1,487 | 3,294 | 3,790 | 2,246 | 0 | |
| Sep-29 | - | 1,487 | 3,293 | 3,790 | 2,235 | 0 | |
| Sep-28 | - | 1,487 | 3,290 | 3,790 | 2,231 | 0 | |
| Sep-27 | - | 1,487 | 3,287 | 3,790 | 2,219 | 0 | |
| Sep-26 | - | 1,487 | 3,286 | 3,790 | 2,198 | 0 | |
| Sep-25 | - | 1,487 | 3,284 | 3,790 | 2,177 | 0 | |
| Sep-24 | - | 1,487 | 3,279 | 3,790 | 2,156 | 0 | |
| Sep-23 | - | 1,487 | 3,278 | 3,785 | 2,138 | 0 | |
| Sep-22 | - | 1,487 | 3,272 | 3,779 | 2,117 | 0 | |
| Sep-21 | - | 1,487 | 3,265 | 3,776 | 2,108 | 0 | |
| Sep-20 | - | 1,487 | 3,254 | 3,772 | 2,102 | 0 | |
| Sep-19 | - | 1,487 | 3,232 | 3,759 | 2,085 | 0 | |
| Sep-18 | - | 1,487 | 3,122 | 3,744 | 2,065 | 0 | |
| Sep-17 | - | 1,487 | 3,110 | 3,727 | 2,031 | 0 | |
| Sep-16 | - | 1,487 | 3,074 | 3,708 | 1,753 | 0 | |
| Sep-15 | - | 1,487 | 3,064 | 3,686 | 1,740 | 0 | |
| Sep-14 | - | 1,487 | 3,044 | 3,648 | 1,728 | 0 | |
| Sep-13 | - | 1,487 | 2,981 | 3,612 | 1,723 | 0 | |
| Sep-12 | - | 1,487 | 2,911 | 3,477 | 1,721 | 0 | |
| Sep-11 | - | 1,487 | 2,765 | 3,452 | 1,715 | 0 | |
| Sep-10 | - | 1,487 | 2,731 | 3,427 | 1,700 | 0 | |
| Sep-09 | - | 1,487 | 2,706 | 3,389 | 1,685 | 0 | |
| Sep-08 | - | 1,487 | 2,674 | 3,338 | 1,667 | 0 | |
| Sep-07 | - | 1,487 | 2,557 | 3,294 | 1,633 | 0 | |
| Sep-06 | - | 1,487 | 2,521 | 3,254 | 1,502 | 0 | |
| Sep-05 | - | 1,487 | 2,471 | 3,230 | 1,487 | 0 | |
| Sep-04 | - | 1,487 | 2,416 | 3,199 | 1,463 | 0 | |
| Sep-03 | - | 1,487 | 2,387 | 3,137 | 1,430 | 0 | |
| Sep-02 | - | 1,487 | 2,379 | 3,069 | 1,381 | 0 | |
| Sep-01 | - | 1,487 | 2,363 | 2,611 | 1,322 | 0 | |
| Aug-31 | - | 1,487 | 2,151 | 2,524 | 1,206 | 0 | |
| Aug-30 | - | 1,487 | 2,000 | 2,487 | 892 | 0 | |
| Aug-29 | - | 1,487 | 1,876 | 2,422 | 794 | 0 | |
| Aug-28 | - | 1,487 | 1,774 | 2,377 | 776 | 0 | |
| Aug-27 | - | 1,487 | 1,629 | 2,301 | 761 | 0 | |
| Aug-26 | 35 | 1,487 | 1,556 | 2,246 | 743 | 0 | Anchor weirs were pulled for the season on 8/26 due to damage from flooding. |
| Aug-25 | 160 | 1,452 | 1,406 | 2,113 | 727 | 0 | |
| Aug-24 | 352 | 1,292 | 1,203 | 1,946 | 708 | 0 | |
| Aug-23 | 39 | 940 | 1,090 | 1,579 | 688 | 0 | |
| Aug-22 | 78 | 901 | 1,022 | 1,157 | 673 | 0 | |
| Aug-21 | 51 | 823 | 923 | 1,050 | 654 | 0 | |
| Aug-20 | 45 | 772 | 791 | 963 | 611 | 0 | |
| Aug-19 | 30 | 727 | 627 | 905 | 501 | 0 | |
| Aug-18 | 37 | 697 | 615 | 849 | 400 | 0 | |
| Aug-17 | 4 | 660 | 605 | 793 | 382 | 0 | |
| Aug-16 | 303 | 656 | 505 | 517 | 345 | 0 | |
| Aug-15 | 39 | 353 | 363 | 468 | 253 | 0 | |
| Aug-14 | 20 | 314 | 334 | 422 | 215 | 0 | |
| Aug-13 | 32 | 294 | 309 | 361 | 200 | 0 | |
| Aug-12 | 25 | 262 | 282 | 312 | 192 | 0 | |
| Aug-11 | 116 | 237 | 217 | 267 | 170 | 0 | |
| Aug-10 | 30 | 121 | 100 | 216 | 144 | 0 | |
| Aug-09 | 15 | 91 | 81 | 147 | 101 | 0 | |
| Aug-08 | 15 | 76 | 68 | 113 | 84 | 0 | |
| Aug-07 | 19 | 61 | 45 | 74 | 54 | 0 | |
| Aug-06 | 7 | 42 | 25 | 59 | 45 | 0 | |
| Aug-05 | 11 | 35 | 24 | 40 | 40 | 0 | |
| Aug-04 | 5 | 24 | 19 | 24 | 32 | 0 | |
| Aug-03 | 6 | 19 | 18 | 19 | 27 | 0 | |
| Aug-02 | 8 | 13 | 14 | 8 | 22 | 0 | |
| Aug-01 | 4 | 5 | 9 | 4 | 18 | 0 | |
| Jul-31 | 0 | 1 | 3 | 4 | 12 | 0 | |
| Jul-30 | 1 | 1 | 2 | 2 | 10 | 0 | |
| Jul-29 | 0 | 0 | 2 | 0 | 5 | 0 | |
| Jul-28 | 0 | 0 | 2 | 0 | 1 | 0 | |
| Jul-27 | 0 | 0 | 2 | 0 | 0 | 0 | |
| Jul-26 | 0 | 0 | 2 | 0 | 0 | 0 | |
| Jul-25 | 0 | 0 | 0 | 0 | 0 | 0 |