Fish Count Data Search
|
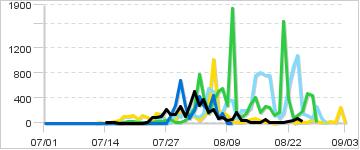
Location: Little Susitna |
The selected years are color-coded in the graphs below:
|
Daily Counts
|
Cumulative
|
|
Description: The Little Susitna weir located at river mile 32.5 will not be operated in 2025. High water has caused substantial damage to the weir in recent years, so alternative assessments will be explored. The primary assessment for Chinook salmon will be aerial survey index counts, and a new sonar project will be tested for feasibility. The weir will be moved this summer to river mile 39.5, a site that is wider and shallower, which combined with improvements to the weir design should provide a more durable assessment. This new weir is planned to be operational for counting coho salmon in 2025 and those counts will be available on this page.
Sustainable Escapement Goal for Chinook:
2,100 - 4,300
|
|
|
Contact:
Assistant Area Management Biologist, |
|
65 records returned for the years selected. Dashes indicate days with no count.
[Export results in Excel format or JSON format]
| Date 2023 |
Count 2023 |
Cumulative 2023 |
Cumulative 2022 |
Cumulative 2021 |
Cumulative 2020 |
Cumulative 2019 |
Notes for 2023 |
|---|---|---|---|---|---|---|---|
| Sep-03 | - | 3,726 | 3,162 | 10,923 | 10,765 | 4,226 | |
| Sep-02 | - | 3,726 | 3,162 | 10,923 | 10,765 | 4,226 | |
| Sep-01 | - | 3,726 | 3,162 | 10,923 | 10,765 | 3,973 | |
| Aug-31 | - | 3,726 | 3,162 | 10,923 | - | 3,963 | |
| Aug-30 | - | 3,726 | 3,162 | 10,923 | 10,765 | 3,940 | |
| Aug-29 | - | 3,726 | 3,162 | - | 10,751 | 3,936 | |
| Aug-28 | - | 3,726 | 3,162 | 10,923 | 10,676 | 3,930 | |
| Aug-27 | - | 3,726 | 3,162 | 10,917 | 10,411 | 3,912 | |
| Aug-26 | - | 3,726 | 3,162 | 10,480 | 10,340 | 3,860 | Weir pulled - flooding |
| Aug-25 | 27 | 3,726 | 3,162 | 10,004 | 10,212 | 3,847 | Water Level 2.46 |
| Aug-24 | 70 | 3,699 | 3,162 | 9,818 | 10,065 | 3,846 | Water level 2.35 |
| Aug-23 | 45 | 3,629 | 3,162 | 9,696 | 8,981 | 3,845 | Water level 2.35 |
| Aug-22 | 19 | 3,584 | 3,162 | 9,628 | 8,073 | 3,845 | Water level 2.38 |
| Aug-21 | 15 | 3,565 | 3,162 | 9,238 | 7,525 | 3,845 | Water Level 2.45 |
| Aug-20 | 9 | 3,550 | 3,162 | 7,606 | 7,370 | 3,844 | |
| Aug-19 | 13 | 3,541 | 3,162 | 7,436 | 7,296 | 3,841 | |
| Aug-18 | 16 | 3,528 | 3,162 | 7,323 | 7,072 | 3,841 | |
| Aug-17 | 51 | 3,512 | 3,162 | 7,066 | 6,312 | 3,837 | Water Level 2.78 |
| Aug-16 | 16 | 3,461 | 3,162 | 6,795 | 5,545 | 3,836 | Water Level 2.6 |
| Aug-15 | 6 | 3,445 | 3,162 | 6,630 | 4,726 | 3,797 | Water Level 2.5 |
| Aug-14 | 3 | 3,439 | 3,162 | 6,226 | 3,955 | 3,727 | Water Level 2.56 |
| Aug-13 | 33 | 3,436 | 3,162 | 5,927 | 3,720 | 3,675 | |
| Aug-12 | 46 | 3,403 | 3,162 | 5,766 | 3,513 | 3,644 | water level 2.7 |
| Aug-11 | 162 | 3,357 | 3,162 | 5,683 | 3,317 | 3,635 | water level 2.72 |
| Aug-10 | 49 | 3,195 | 3,162 | 5,533 | 3,251 | 3,629 | Water Level 2.7 |
| Aug-09 | 43 | 3,146 | 3,162 | 3,682 | 2,890 | 3,598 | |
| Aug-08 | 89 | 3,103 | 3,162 | 3,408 | 2,516 | 3,471 | Water Level 2.8 |
| Aug-07 | 74 | 3,014 | 3,006 | 2,854 | 2,342 | 3,280 | Water Level 2.85 |
| Aug-06 | 223 | 2,940 | 2,941 | 2,352 | 2,250 | 3,117 | water level 2.9 |
| Aug-05 | 174 | 2,717 | 2,499 | 2,004 | 1,746 | 2,091 | water level 2.95 |
| Aug-04 | 372 | 2,543 | 2,293 | 1,844 | 1,196 | 1,853 | water level 3.0 |
| Aug-03 | 280 | 2,171 | 2,013 | 1,397 | 1,047 | 1,748 | |
| Aug-02 | 503 | 1,891 | 1,590 | 620 | 952 | 1,701 | Water level 3.20 |
| Aug-01 | 258 | 1,388 | 1,396 | 372 | 835 | 1,604 | Water level3.34 |
| Jul-31 | 98 | 1,130 | 1,316 | 268 | 615 | 1,447 | |
| Jul-30 | 262 | 1,032 | 1,058 | 234 | 420 | 1,346 | |
| Jul-29 | 142 | 770 | 374 | 222 | 323 | 1,153 | water level 3.42 |
| Jul-28 | 136 | 628 | 100 | 217 | 191 | 1,091 | water level 3.6 |
| Jul-27 | 217 | 492 | 0 | 161 | 178 | 1,040 | Water Level 3.60 |
| Jul-26 | 101 | 275 | 0 | 128 | 169 | 1,023 | water level 3.8 |
| Jul-25 | 81 | 174 | 0 | 99 | 31 | 881 | Water level 3.90 |
| Jul-24 | 83 | 93 | 0 | 82 | 29 | 729 | water level 4.1 |
| Jul-23 | 4 | 10 | 0 | 69 | 20 | 668 | Water level 4.3 |
| Jul-22 | 0 | 6 | 0 | 66 | 16 | 586 | weir flooded |
| Jul-21 | 0 | 6 | 0 | 64 | 12 | 464 | weir flooded |
| Jul-20 | 0 | 6 | 0 | 59 | 5 | 403 | Water level 5.02 Weir flooded |
| Jul-19 | 0 | 6 | 0 | 38 | 2 | 287 | weir flooded water level 5.50 |
| Jul-18 | 0 | 6 | 0 | 6 | 1 | 178 | weir flooded water level 6.00 |
| Jul-17 | 0 | 6 | 0 | 0 | 0 | 73 | weir flooded |
| Jul-16 | 4 | 6 | 0 | 0 | 0 | 29 | |
| Jul-15 | 1 | 2 | 0 | 0 | 0 | 5 | |
| Jul-14 | 1 | 1 | 0 | 0 | 0 | 2 | |
| Jul-13 | - | - | 0 | 0 | 0 | 2 | |
| Jul-12 | - | - | 0 | 0 | 0 | 1 | |
| Jul-11 | - | - | 0 | 0 | 0 | 1 | |
| Jul-10 | - | - | 0 | 0 | 0 | 1 | |
| Jul-09 | - | - | 0 | 0 | 0 | 1 | |
| Jul-08 | - | - | 0 | 0 | 0 | 1 | |
| Jul-07 | - | - | 0 | 0 | 0 | 1 | |
| Jul-06 | - | - | 0 | 0 | 0 | 0 | |
| Jul-05 | - | - | 0 | 0 | 0 | 0 | |
| Jul-04 | - | - | 0 | 0 | 0 | 0 | |
| Jul-03 | - | - | 0 | 0 | 0 | 0 | |
| Jul-02 | - | - | 0 | 0 | 0 | 0 | |
| Jul-01 | - | - | 0 | 0 | 0 | 0 |