Kenai Chinook Estimates, Indices and Inseason Run Summaries
See also the prior Final Early Run Chinook Inseason Summary
|
Location: Kenai River (Chinook) |
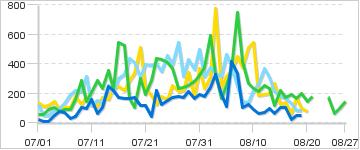
The selected years are color-coded in the graphs below:
|
Daily Counts
|
Cumulative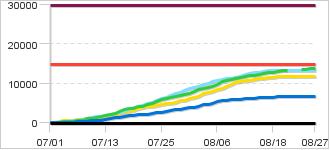
|
|
Description: In 2015 the department began managing Kenai River king salmon runs using an ARIS sonar station located at river mile 14. In 2017 the Department modified the Kenai River king salmon escapement goals from goals based on king salmon of all sizes, to escapement goals based on large king salmon (fish over 34 inches) only. The early-run king salmon optimal escapement goal range is 3,900 to 6,600 large king salmon (> 34 inches). In 2020 the late-run king salmon escapement goal was modified to an optimal escapement goal range is 15,000 to 30,000 large king salmon (> 34 inches). The ARIS sonar counts found on this page are the daily and seasonal cumulative passage estimates of the number of large king salmon passing the sonar site. Additionally, the past years counts displayed on this page have been converted to large fish counts for comparison. These estimated numbers of large king salmon passing the sonar site are the primary tool for the Kenai River king salmon assessment program that also includes a sport angler harvest survey, and a netting program. The data gathered in these assessments are used together to determine king salmon run strength. This data in conjunction with Fishery Management Plans, allows fishery managers to determine if emergency order regulation changes to the fisheries are needed during the season to help ensure that the escapement goals are achieved. These abundance assessments as well as information about the status of the run and inseason management actions can be viewed via this website on the above tabs. Information is also available by telephone at (907)262-9097.
Optimal Escapement Goal for Chinook - Early Run:
3,900 - 6,600
|
|
|
Contact:
Area Management Biologist, | |
58 records returned for the years selected. Dashes indicate days with no count.
[Export results in Excel format or JSON format]
| Date 2025 |
Count 2025 |
Cumulative 2025 |
Cumulative 2024 |
Cumulative 2023 |
Cumulative 2022 |
Cumulative 2021 |
Notes for 2025 |
|---|---|---|---|---|---|---|---|
| Aug-27 | - | 0 | 6,630 | 13,922 | 13,425 | 11,832 | |
| Aug-26 | - | 0 | 6,630 | 13,776 | 13,425 | 11,832 | |
| Aug-25 | - | 0 | 6,630 | 13,679 | 13,425 | 11,832 | |
| Aug-24 | - | 0 | 6,630 | 13,612 | 13,425 | 11,832 | |
| Aug-23 | - | 0 | 6,630 | - | 13,425 | 11,832 | |
| Aug-22 | - | 0 | 6,630 | - | 13,425 | 11,832 | |
| Aug-21 | - | 0 | 6,630 | 13,436 | 13,425 | 11,832 | |
| Aug-20 | - | 0 | 6,630 | 13,257 | 13,425 | 11,832 | |
| Aug-19 | - | 0 | 6,630 | 13,111 | 13,425 | 11,754 | |
| Aug-18 | - | 0 | 6,582 | 12,911 | 13,338 | 11,656 | |
| Aug-17 | - | 0 | 6,534 | 12,747 | 13,253 | 11,486 | |
| Aug-16 | - | 0 | 6,510 | 12,552 | 13,124 | 11,419 | |
| Aug-15 | - | 0 | 6,408 | 12,381 | 12,961 | 11,279 | |
| Aug-14 | - | 0 | 6,306 | 12,161 | 12,779 | 11,151 | |
| Aug-13 | - | 0 | 6,240 | 12,045 | 12,567 | 10,884 | |
| Aug-12 | - | 0 | 6,143 | 11,814 | 12,257 | 10,684 | |
| Aug-11 | - | 0 | 6,070 | 11,559 | 11,887 | 10,491 | |
| Aug-10 | - | 0 | 6,008 | 11,347 | 11,626 | 10,303 | |
| Aug-09 | - | 0 | 5,917 | 11,111 | 11,407 | 9,757 | |
| Aug-08 | - | 0 | 5,790 | 10,844 | 11,270 | 9,248 | |
| Aug-07 | - | 0 | 5,687 | 10,424 | 11,124 | 8,872 | |
| Aug-06 | - | 0 | 5,349 | 9,677 | 10,875 | 8,419 | |
| Aug-05 | - | 0 | 4,932 | 9,313 | 10,487 | 8,064 | |
| Aug-04 | - | 0 | 4,817 | 9,058 | 10,024 | 7,747 | |
| Aug-03 | - | 0 | 4,624 | 8,889 | 9,711 | 7,504 | |
| Aug-02 | - | 0 | 4,298 | 8,555 | 9,377 | 6,729 | |
| Aug-01 | - | 0 | 4,056 | 7,960 | 9,001 | 6,420 | |
| Jul-31 | - | 0 | 3,875 | 7,582 | 8,686 | 6,189 | |
| Jul-30 | - | 0 | 3,682 | 7,260 | 8,189 | 5,818 | |
| Jul-29 | - | 0 | 3,519 | 6,980 | 7,825 | 5,636 | |
| Jul-28 | - | 0 | 3,308 | 6,725 | 7,394 | 5,296 | |
| Jul-27 | - | 0 | 3,133 | 6,481 | 7,077 | 5,077 | |
| Jul-26 | - | 0 | 2,952 | 6,250 | 6,531 | 4,864 | |
| Jul-25 | - | 0 | 2,777 | 5,880 | 6,136 | 4,610 | |
| Jul-24 | - | 0 | 2,626 | 5,467 | 5,675 | 4,452 | |
| Jul-23 | - | 0 | 2,503 | 5,036 | 5,329 | 4,270 | |
| Jul-22 | - | 0 | 2,286 | 4,600 | 4,927 | 4,142 | |
| Jul-21 | - | 0 | 2,244 | 4,309 | 4,539 | 3,953 | |
| Jul-20 | - | 0 | 2,123 | 4,114 | 4,142 | 3,717 | |
| Jul-19 | - | 0 | 2,002 | 3,811 | 3,832 | 3,207 | |
| Jul-18 | - | 0 | 1,827 | 3,708 | 3,419 | 2,872 | |
| Jul-17 | - | 0 | 1,658 | 3,544 | 2,982 | 2,581 | |
| Jul-16 | - | 0 | 1,489 | 3,016 | 2,655 | 2,363 | |
| Jul-15 | - | 0 | 1,317 | 2,469 | 2,352 | 2,113 | |
| Jul-14 | - | 0 | 1,097 | 2,244 | 2,147 | 1,871 | |
| Jul-13 | - | 0 | 848 | 1,886 | 1,890 | 1,714 | |
| Jul-12 | - | 0 | 745 | 1,654 | 1,751 | 1,538 | |
| Jul-11 | - | 0 | 681 | 1,369 | 1,597 | 1,423 | |
| Jul-10 | - | 0 | 520 | 1,163 | 1,475 | 1,303 | |
| Jul-09 | - | 0 | 423 | 1,018 | 1,162 | 1,121 | |
| Jul-08 | - | 0 | 320 | 733 | 950 | 994 | |
| Jul-07 | - | 0 | 277 | 575 | 731 | 812 | |
| Jul-06 | - | 0 | 247 | 484 | 537 | 709 | |
| Jul-05 | - | 0 | 175 | 393 | 404 | 606 | |
| Jul-04 | - | 0 | 96 | 314 | 307 | 515 | |
| Jul-03 | - | 0 | 48 | 211 | 222 | 369 | |
| Jul-02 | - | 0 | 36 | 120 | 172 | 253 | |
| Jul-01 | - | 0 | 24 | 60 | 123 | 140 |
Non-Sonar Tools
Late Run Netting Project CPUE Index

The Net Catch Per Unit Effort (CPUE) is an index of the numbers of Chinook salmon moving into the Kenai River and is based on the rate at which Chinook salmon are captured by the netting project conducted at river mile 8.6.
Late Run Sport CPUE Index

The Sport Catch Per Unit Effort (CPUE) is an index of the numbers of Chinook salmon in the lower Kenai River and is based on the success rate of anglers fishing downstream of the Sterling Highway Bridge Crossing in Soldotna.
Late Run Netting Project Large Fish CPUE Index

The Net Catch Per Unit Effort (CPUE) is an index of the numbers of Chinook salmon moving into the Kenai River and is based on the rate at which Chinook salmon are captured by the netting project conducted at the sonar station located at river mile 8.6.
Late Run Netting Project CPUE Index
The Net Catch Per Unit Effort (CPUE) is an index of the numbers of Chinook salmon moving into the Kenai River and is based on the rate at which Chinook salmon are captured by the netting project conducted at river mile 8.6.
Late Run Sport CPUE Index
The Sport Catch Per Unit Effort (CPUE) is an index of the numbers of Chinook salmon in the lower Kenai River and is based on the success rate of anglers fishing downstream of the Sterling Highway Bridge Crossing in Soldotna.
Late Run Netting Project Large Fish CPUE Index
The Net Catch Per Unit Effort (CPUE) is an index of the numbers of Chinook salmon moving into the Kenai River and is based on the rate at which Chinook salmon are captured by the netting project conducted at the sonar station located at river mile 8.6.
Weekly Sportfish Fishing Report for this area
Late Run Kenai River Chinook Inseason Summary for Fri. Jul 17
KENAI RIVER LATE-RUN KING SALMON SUMMARY #05
King Salmon Run Update:
Estimation of the late-run began on July 1, the cumulative estimated passage through July 20 is 4,164 large king salmon. The optimal escapement goal is 15,000 – 30,000 large king salmon. Inseason assessment of the king salmon run consists of the sonar at RM 14 on the Kenai River mainstem, a sport angler creel survey of the lower river, inriver test netting for age, sex, length composition, and sampling of king salmon harvest in the east side set net commercial fishery. These ongoing information sources, along with historical data allow ADF&G managers to formulate inseason run projections of estimated escapement, harvest, and total run of large Kenai River king salmon. Figure 1 is a table of the 2020 projections using data that is available on July 19. The inseason projection of escapement using the historical mean run timing is approximately 12,500 fish. Inseason run projections do fluctuate while we are still early in the run (34% mean run timing) and should start to solidify and confidence intervals will narrow as the run approaches the average mid-point on July 27.
In response to low inseason projections of escapement and below average king salmon returns across Cook Inlet, ADF&G restricted the king salmon fishery downstream of the lower Slikok Creek markers by prohibiting the retention of king salmon of all sizes effective 12:01 AM Wednesday, July 15, 2020. King salmon fishing upstream from ADF&G markers downstream of Slikok Creek to the outlet of Skilak Lake will remain closed through July 31, 2020 as directed in regulation under the Kenai River and Kasilof River Early-run King Salmon Management Plan.
The next inseason summary will be updated July 24.
Fishery Update:
Fishing success was reported as fair to good so far this week. CPUE data collected from the netting program indicates a catch of all sizes and large king salmon are near the 5-year average but below the historical average. The creel survey of sport anglers indicates near average catch for all sizes of fish.
The preseason outlook for the 2020 late-run can be found at:
http://www.adfg.alaska.gov/static/fishing/pdfs/sport/byarea/southcentral/2020KenaiLateRunOutlook.pdf.
Water Conditions:
Water levels as of July 21 in the Kenai River are below average in the upper river and average in the lower river.
CFS at Soldotna Bridge was 13,800 and 9.36 ft
CFS at Skilak Lake Outlet was 12,200 and 11.22 ft
CFS at Cooper Landing was 6,030 and 10.41 ft
Water Temperature was 56 degrees Fahrenheit at the sonar site.
This information was compiled based on raw and historical data for inseason management purposes.
Final data is subject to change.
Figure 1. 2020 Inseason Summary Estimates for Kenai River Late-run Large Chinook Salmon
| Sonar data thru: | 20-Jul | ESSN Summary | ||||||||
| Current Inriver Chinook Assessment Information | ESSN Total Chinook Salmon harvest | 699 | (Fish Ticket Catch Report) | |||||||
| Most Recent Daily Sonar | 285 | ESSN Large Chinook Harvests (all stocks) Based on Inseason Length Data | 175 | |||||||
| Cumulative Sonar to Date | 4,164 | Percentage Large Chinook in ESSN Sample Thru | 20-Jul | 25% | ||||||
| Est. Creel Harvest to Date | 0 | Min, mean, and max of Large ESSN Chinook that were of Kenai origin (2010-2018 data) | ||||||||
| Creel Harvest Above Sonar | 0 | Kenai Large Contribution | 60% | 69% | 79% | |||||
| Creel Harvest Below Sonar | 0 | ESSN Large Kenai Harvest to Date | 105 | 121 | 138 | |||||
| Creel All Sizes of Chinook | 67 | ESSN Projected Kenai Large Harvest | 174 | 200 | 229 | |||||
| Projected end of season estimates for large late-run Kenai River Chinook salmon. | ||||||||||
| Run Timing | Run to Date | Estimated run to Sonar RM14 | Estimated inriver run (includes spawning & harvet below sonar) | Estimated Escapement (includes spawners below sonar) | Estimated Sport Harvest Above Sonar RM 14 to Skilak Lake | Estimated Sport Harvest Below Sonar RM 14 | Estimated Total Inriver Sport Harvest | Estimated ESSN Harvest | Estimated Total Run | Estimated Exploitation |
| On time | 34.19% | 12,180 | 12,736 | 12,552 | 130 | 54 | 184 | 200 | 12,882 | 2.98% |
| Early Timing Scenarios | ||||||||||
| 1 early | 36.75% | 11,331 | 11,850 | 11,722 | 79 | 50 | 129 | 189 | 12,022 | 2.64% |
| 2 early | 39.30% | 10,594 | 11,079 | 10,960 | 73 | 46 | 119 | 183 | 11,279 | 2.68% |
| Late Timing Scenarios | ||||||||||
| 1 late | 31.61% | 13,175 | 13,778 | 13,628 | 91 | 58 | 149 | 214 | 13,891 | 2.62% |
| 2 late | 28.98% | 14,367 | 15,025 | 14,861 | 100 | 63 | 164 | 228 | 15,097 | 2.59% |