Kenai Chinook Estimates, Indices and Inseason Run Summaries
|
Location: Kenai River (Chinook) |
The selected years are color-coded in the graphs below:
|
Daily Counts
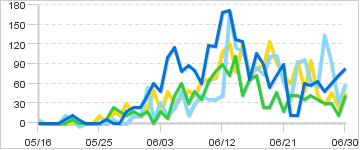
* graphs are images and may be cached by browser |
Cumulative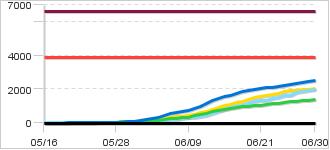
|
|
Description: In 2015 the department began managing Kenai River king salmon runs using an ARIS sonar station located at river mile 14. In 2017 the Department modified the Kenai River king salmon escapement goals from goals based on king salmon of all sizes, to escapement goals based on large king salmon (fish over 34 inches) only. The early-run king salmon optimal escapement goal range is 3,900 to 6,600 large king salmon (> 34 inches). In 2020 the late-run king salmon escapement goal was modified to an optimal escapement goal range is 15,000 to 30,000 large king salmon (> 34 inches). The ARIS sonar counts found on this page are the daily and seasonal cumulative passage estimates of the number of large king salmon passing the sonar site. Additionally, the past years counts displayed on this page have been converted to large fish counts for comparison. These estimated numbers of large king salmon passing the sonar site are the primary tool for the Kenai River king salmon assessment program that also includes a sport angler harvest survey, and a netting program. The data gathered in these assessments are used together to determine king salmon run strength. This data in conjunction with Fishery Management Plans, allows fishery managers to determine if emergency order regulation changes to the fisheries are needed during the season to help ensure that the escapement goals are achieved. These abundance assessments as well as information about the status of the run and inseason management actions can be viewed via this website on the above tabs. Information is also available by telephone at (907)262-9097.
Optimal Escapement Goal for Chinook - Early Run:
3,900 - 6,600
(Graphed above)
|
|
|
Contact:
Area Management Biologist, | |
46 records returned for the years selected. Dashes indicate days with no count.
[Export results in Excel format or JSON format]
| Date 2026 |
Count 2026 |
Cumulative 2026 |
Cumulative 2025 |
Cumulative 2024 |
Cumulative 2023 |
Cumulative 2022 |
Notes for 2026 |
|---|---|---|---|---|---|---|---|
| 06/30 | - | 0 | 2,541 | 1,365 | 1,975 | 2,051 | |
| 06/29 | - | 0 | 2,458 | 1,323 | 1,914 | 2,004 | |
| 06/28 | - | 0 | 2,386 | 1,311 | 1,884 | 1,980 | |
| 06/27 | - | 0 | 2,326 | 1,281 | 1,793 | 1,934 | |
| 06/26 | - | 0 | 2,278 | 1,251 | 1,660 | 1,906 | |
| 06/25 | - | 0 | 2,214 | 1,215 | 1,605 | 1,864 | |
| 06/24 | - | 0 | 2,157 | 1,173 | 1,541 | 1,768 | |
| 06/23 | - | 0 | 2,097 | 1,137 | 1,444 | 1,719 | |
| 06/22 | - | 0 | 2,085 | 1,095 | 1,352 | 1,625 | |
| 06/21 | - | 0 | 2,073 | 1,053 | 1,316 | 1,564 | |
| 06/20 | - | 0 | 1,983 | 1,035 | 1,255 | 1,491 | |
| 06/19 | - | 0 | 1,911 | 989 | 1,152 | 1,400 | |
| 06/18 | - | 0 | 1,857 | 965 | 1,051 | 1,276 | |
| 06/17 | - | 0 | 1,767 | 941 | 977 | 1,188 | |
| 06/16 | - | 0 | 1,661 | 868 | 892 | 1,103 | |
| 06/15 | - | 0 | 1,594 | 802 | 813 | 1,030 | |
| 06/14 | - | 0 | 1,470 | 760 | 704 | 909 | |
| 06/13 | - | 0 | 1,342 | 658 | 589 | 830 | |
| 06/12 | - | 0 | 1,170 | 586 | 419 | 708 | |
| 06/11 | - | 0 | 1,001 | 496 | 377 | 599 | |
| 06/10 | - | 0 | 885 | 418 | 341 | 530 | |
| 06/09 | - | 0 | 767 | 355 | 305 | 463 | |
| 06/08 | - | 0 | 707 | 319 | 263 | 398 | |
| 06/07 | - | 0 | 627 | 271 | 233 | 356 | |
| 06/06 | - | 0 | 540 | 241 | 221 | 307 | |
| 06/05 | - | 0 | 461 | 181 | 173 | 265 | |
| 06/04 | - | 0 | 346 | 139 | 149 | 235 | |
| 06/03 | - | 0 | 246 | 132 | 137 | 187 | |
| 06/02 | - | 0 | 198 | 114 | 106 | 169 | |
| 06/01 | - | 0 | 138 | 114 | 100 | 120 | |
| 05/31 | - | 0 | 96 | 96 | 46 | 96 | |
| 05/30 | - | 0 | 72 | 84 | 36 | 84 | |
| 05/29 | - | 0 | 48 | 66 | 24 | 72 | |
| 05/28 | - | 0 | 30 | 54 | 24 | 42 | |
| 05/27 | - | 0 | 30 | 36 | 24 | 30 | |
| 05/26 | - | 0 | 30 | 12 | 18 | 12 | |
| 05/25 | - | 0 | 24 | 6 | 18 | 12 | |
| 05/24 | - | 0 | 24 | 6 | 18 | 0 | |
| 05/23 | - | 0 | 24 | 6 | 18 | 0 | |
| 05/22 | - | 0 | 24 | 6 | 18 | 0 | |
| 05/21 | - | 0 | 18 | 6 | 24 | 0 | |
| 05/20 | - | 0 | 6 | 0 | 18 | 0 | |
| 05/19 | - | 0 | 0 | 0 | 6 | 0 | |
| 05/18 | - | 0 | 0 | 0 | 6 | 0 | |
| 05/17 | - | 0 | 0 | 0 | 6 | 0 | |
| 05/16 | - | 0 | 0 | 0 | 6 | 0 |
Non-Sonar Tools
Early Run Netting Project CPUE Index

The Net Catch Per Unit Effort (CPUE) is an index of the numbers of Chinook salmon moving into the Kenai River and is based on the rate at which Chinook salmon are captured by the netting project conducted at river mile 8.6.
Early Run Sport CPUE Index

The Sport Catch Per Unit Effort (CPUE) is an index of the numbers of Chinook salmon in the lower Kenai River and is based on the success rate of anglers fishing downstream of the Sterling Highway Bridge Crossing in Soldotna.
Early Run Netting Project Large Fish CPUE Index

The Net Catch Per Unit Effort (CPUE) is an index of the numbers of Chinook salmon moving into the Kenai River and is based on the rate at which Chinook salmon are captured by the netting project conducted at the sonar station located at river mile 8.6.
Early Run Netting Project CPUE Index
The Net Catch Per Unit Effort (CPUE) is an index of the numbers of Chinook salmon moving into the Kenai River and is based on the rate at which Chinook salmon are captured by the netting project conducted at river mile 8.6.
Early Run Sport CPUE Index
The Sport Catch Per Unit Effort (CPUE) is an index of the numbers of Chinook salmon in the lower Kenai River and is based on the success rate of anglers fishing downstream of the Sterling Highway Bridge Crossing in Soldotna.
Early Run Netting Project Large Fish CPUE Index
The Net Catch Per Unit Effort (CPUE) is an index of the numbers of Chinook salmon moving into the Kenai River and is based on the rate at which Chinook salmon are captured by the netting project conducted at the sonar station located at river mile 8.6.
Weekly Sportfish Fishing Report for this area
Final Early Run Kenai River Chinook Inseason Summary
KENAI RIVER EARLY-RUN KING SALMON FINAL 2023 SUMMARY
King Salmon Run Update:
The total estimated passage through June 30 was 1,975 large king salmon (> 75 cm mid-eye-to-tail-fork-length or ~ 34 inches in total length). The return is ~33% below the preseason forecast estimate of ~2,900 large fish and the10-year average of 4,800 large fish. The mid-point of the run occurred on June 17 which is 5 days late when compared to the historical mid-point of June 12. Preliminary age composition estimates from length groups show a notable low presence of 2-ocean and 4-ocean fish (brood years 2019 and 2017). The age class composition estimated from length bins for all sized king salmon are the 3-ocean fish at ~44%, 1-ocean at ~30%, 4-ocean at ~14%, and the 2-ocean fish at ~13% of the run. These estimates are preliminary until scales collected from the test netting program are aged. The run exhibited generally low abundance across all age classes and is preliminarily the second lowest run in the historical data set.
Neither the optimal escapement goal (3,900 – 6,600) nor the sustainable escapement goal (2,800 – 5,600) were achieved.
The preseason outlook for the 2023 early-run can be found at:
This information was compiled based on raw and historical data for inseason management purposes.
Final data is subject to change.