Kenai Chinook Estimates, Indices and Inseason Run Summaries
See also the prior Final Early Run Chinook Inseason Summary
|
Location: Kenai River (Chinook) |
The selected years are color-coded in the graphs below:
|
Daily Counts
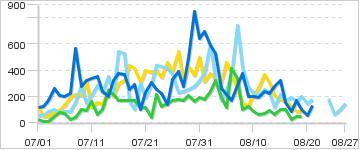
* graphs are images and may be cached by browser |
Cumulative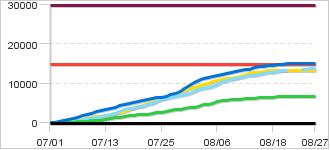
|
|
Description: In 2015 the department began managing Kenai River king salmon runs using an ARIS sonar station located at river mile 14. In 2017 the Department modified the Kenai River king salmon escapement goals from goals based on king salmon of all sizes, to escapement goals based on large king salmon (fish over 34 inches) only. The early-run king salmon optimal escapement goal range is 3,900 to 6,600 large king salmon (> 34 inches). In 2020 the late-run king salmon escapement goal was modified to an optimal escapement goal range is 15,000 to 30,000 large king salmon (> 34 inches). The ARIS sonar counts found on this page are the daily and seasonal cumulative passage estimates of the number of large king salmon passing the sonar site. Additionally, the past years counts displayed on this page have been converted to large fish counts for comparison. These estimated numbers of large king salmon passing the sonar site are the primary tool for the Kenai River king salmon assessment program that also includes a sport angler harvest survey, and a netting program. The data gathered in these assessments are used together to determine king salmon run strength. This data in conjunction with Fishery Management Plans, allows fishery managers to determine if emergency order regulation changes to the fisheries are needed during the season to help ensure that the escapement goals are achieved. These abundance assessments as well as information about the status of the run and inseason management actions can be viewed via this website on the above tabs. Information is also available by telephone at (907)262-9097.
Optimal Escapement Goal for Chinook - Early Run:
3,900 - 6,600
|
|
|
Contact:
Area Management Biologist, | |
58 records returned for the years selected. Dashes indicate days with no count.
[Export results in Excel format or JSON format]
| Date 2026 |
Count 2026 |
Cumulative 2026 |
Cumulative 2025 |
Cumulative 2024 |
Cumulative 2023 |
Cumulative 2022 |
Notes for 2026 |
|---|---|---|---|---|---|---|---|
| 08/27 | - | 4,614 | 15,015 | 6,630 | 13,922 | 13,425 | |
| 08/26 | - | 4,614 | 15,015 | 6,630 | 13,776 | 13,425 | |
| 08/25 | - | 4,614 | 15,015 | 6,630 | 13,679 | 13,425 | |
| 08/24 | - | 4,614 | 15,015 | 6,630 | 13,612 | 13,425 | |
| 08/23 | - | 4,614 | 15,015 | 6,630 | - | 13,425 | |
| 08/22 | - | 4,614 | 15,015 | 6,630 | - | 13,425 | |
| 08/21 | - | 4,614 | 15,015 | 6,630 | 13,436 | 13,425 | |
| 08/20 | - | 4,614 | 14,884 | 6,630 | 13,257 | 13,425 | |
| 08/19 | - | 4,614 | 14,824 | 6,630 | 13,111 | 13,425 | |
| 08/18 | - | 4,614 | 14,722 | 6,582 | 12,911 | 13,338 | |
| 08/17 | - | 4,614 | 14,553 | 6,534 | 12,747 | 13,253 | |
| 08/16 | - | 4,614 | 14,469 | 6,510 | 12,552 | 13,124 | |
| 08/15 | - | 4,614 | 14,312 | 6,408 | 12,381 | 12,961 | |
| 08/14 | - | 4,614 | 13,987 | 6,306 | 12,161 | 12,779 | |
| 08/13 | - | 4,614 | 13,709 | 6,240 | 12,045 | 12,567 | |
| 08/12 | - | 4,614 | 13,486 | 6,143 | 11,814 | 12,257 | |
| 08/11 | - | 4,614 | 13,245 | 6,070 | 11,559 | 11,887 | |
| 08/10 | - | 4,614 | 13,051 | 6,008 | 11,347 | 11,626 | |
| 08/09 | - | 4,614 | 12,852 | 5,917 | 11,111 | 11,407 | |
| 08/08 | - | 4,614 | 12,653 | 5,790 | 10,844 | 11,270 | |
| 08/07 | - | 4,614 | 12,274 | 5,687 | 10,424 | 11,124 | |
| 08/06 | - | 4,614 | 11,985 | 5,349 | 9,677 | 10,875 | |
| 08/05 | - | 4,614 | 11,810 | 4,932 | 9,313 | 10,487 | |
| 08/04 | - | 4,614 | 11,593 | 4,817 | 9,058 | 10,024 | |
| 08/03 | - | 4,614 | 11,327 | 4,624 | 8,889 | 9,711 | |
| 08/02 | - | 4,614 | 10,797 | 4,298 | 8,555 | 9,377 | |
| 08/01 | - | 4,614 | 10,207 | 4,056 | 7,960 | 9,001 | |
| 07/31 | - | 4,614 | 9,508 | 3,875 | 7,582 | 8,686 | |
| 07/30 | - | 4,614 | 8,864 | 3,682 | 7,260 | 8,189 | |
| 07/29 | - | 4,614 | 8,015 | 3,519 | 6,980 | 7,825 | |
| 07/28 | - | 4,614 | 7,521 | 3,308 | 6,725 | 7,394 | |
| 07/27 | 193 | 4,614 | 7,244 | 3,133 | 6,481 | 7,077 | |
| 07/26 | 216 | 4,421 | 6,853 | 2,952 | 6,250 | 6,531 | |
| 07/25 | 308 | 4,205 | 6,522 | 2,777 | 5,880 | 6,136 | |
| 07/24 | 518 | 3,897 | 6,384 | 2,626 | 5,467 | 5,675 | |
| 07/23 | 306 | 3,379 | 6,161 | 2,503 | 5,036 | 5,329 | |
| 07/22 | 211 | 3,073 | 5,902 | 2,286 | 4,600 | 4,927 | |
| 07/21 | 186 | 2,862 | 5,595 | 2,244 | 4,309 | 4,539 | |
| 07/20 | 151 | 2,676 | 5,360 | 2,123 | 4,114 | 4,142 | |
| 07/19 | 150 | 2,525 | 5,258 | 2,002 | 3,811 | 3,832 | |
| 07/18 | 111 | 2,375 | 4,963 | 1,827 | 3,708 | 3,419 | |
| 07/17 | 122 | 2,264 | 4,710 | 1,658 | 3,544 | 2,982 | |
| 07/16 | 157 | 2,142 | 4,337 | 1,489 | 3,016 | 2,655 | |
| 07/15 | 241 | 1,985 | 3,958 | 1,317 | 2,469 | 2,352 | |
| 07/14 | 193 | 1,744 | 3,633 | 1,097 | 2,244 | 2,147 | |
| 07/13 | 303 | 1,551 | 3,434 | 848 | 1,886 | 1,890 | |
| 07/12 | 168 | 1,248 | 3,193 | 745 | 1,654 | 1,751 | |
| 07/11 | 102 | 1,080 | 2,838 | 681 | 1,369 | 1,597 | |
| 07/10 | 228 | 978 | 2,498 | 520 | 1,163 | 1,475 | |
| 07/09 | 174 | 750 | 2,172 | 423 | 1,018 | 1,162 | |
| 07/08 | 108 | 576 | 1,895 | 320 | 733 | 950 | |
| 07/07 | 48 | 468 | 1,323 | 277 | 575 | 731 | |
| 07/06 | 60 | 420 | 1,100 | 247 | 484 | 537 | |
| 07/05 | 84 | 360 | 895 | 175 | 393 | 404 | |
| 07/04 | 78 | 276 | 685 | 96 | 314 | 307 | |
| 07/03 | 78 | 198 | 421 | 48 | 211 | 222 | |
| 07/02 | 78 | 120 | 246 | 36 | 120 | 172 | |
| 07/01 | 42 | 42 | 120 | 24 | 60 | 123 |
Non-Sonar Tools
Late Run Netting Project CPUE Index

The Net Catch Per Unit Effort (CPUE) is an index of the numbers of Chinook salmon moving into the Kenai River and is based on the rate at which Chinook salmon are captured by the netting project conducted at river mile 8.6.
Late Run Sport CPUE Index

The Sport Catch Per Unit Effort (CPUE) is an index of the numbers of Chinook salmon in the lower Kenai River and is based on the success rate of anglers fishing downstream of the Sterling Highway Bridge Crossing in Soldotna.
Late Run Netting Project Large Fish CPUE Index

The Net Catch Per Unit Effort (CPUE) is an index of the numbers of Chinook salmon moving into the Kenai River and is based on the rate at which Chinook salmon are captured by the netting project conducted at the sonar station located at river mile 8.6.
Late Run Netting Project CPUE Index
The Net Catch Per Unit Effort (CPUE) is an index of the numbers of Chinook salmon moving into the Kenai River and is based on the rate at which Chinook salmon are captured by the netting project conducted at river mile 8.6.
Late Run Sport CPUE Index
The Sport Catch Per Unit Effort (CPUE) is an index of the numbers of Chinook salmon in the lower Kenai River and is based on the success rate of anglers fishing downstream of the Sterling Highway Bridge Crossing in Soldotna.
Late Run Netting Project Large Fish CPUE Index
The Net Catch Per Unit Effort (CPUE) is an index of the numbers of Chinook salmon moving into the Kenai River and is based on the rate at which Chinook salmon are captured by the netting project conducted at the sonar station located at river mile 8.6.
Weekly Sportfish Fishing Report for this area
Late Run Kenai River Chinook Inseason Summary for Mon. Jul 29
KENAI RIVER LATE-RUN KING SALMON INSEASON SUMMARY #7
FRIDAY JULY 29
King Salmon Run Update:
Abundance estimation of Kenai River late-run king salmon began on July 1. The cumulative estimated passage thru July 28th was 8,373 large king salmon (≥ 75 cm mid-eye-to-tail-fork-length or ~ 34 inches in total length). The preseason forecast of 21,700 large king salmon is well below average. The sustainable escapement goal is 13,500– 27,000 large king salmon. Inseason assessment of the king salmon run consists of the sonar at RM 14 on the Kenai River mainstem, a sport angler creel survey of the lower river, inriver test netting for age, sex, length composition, and sampling of king salmon harvest in the east side set net commercial fishery. These ongoing information sources, along with historical data allow ADF&G managers to formulate inseason run projections of estimated escapement, harvest, and total run of large Kenai River king salmon. Table 1 displays the 2019 projection using data that is available on July 28.
In response to the low forecast, inseason projections, and general performance of king salmon runs throughout Cook Inlet, ADF&G has restricted the king salmon fishery downstream from Slikok Creek by prohibiting the use of bait and multiple hooks. King salmon fishing upstream from ADF&G markers downstream of Slikok Creek to the outlet of Skilak Lake will be under general regulation, which allows for 1 king salmon per a day, in possession that is less than 36 inches in total length using a single, unbaited hook, or artificial lure. Additionally, in the Kenai River personal use dip net fishery the retention of king salmon is prohibited by emergency order.
Inseason run projections increased early in the week but have declined recently. No management actions are anticipated at this time. The final inseason summary will be provided on Thursday, August 1st.
Fishery Update:
Fishing effort and catch rates have been below average as water conditions have been unfavorable to anglers. The Kenai River is experiencing above average temperatures and turbid water conditions which have diminished angler success rate for king salmon. Water levels have started to drop and clarity is improving. Overall effort has remained low since July 1.
For complete information about the late-run outlook please visit the following link:
http://www.adfg.alaska.gov/static/fishing/pdfs/sport/byarea/southcentral/2019KenaiLateRunOutlook.pdf
Water Conditions:
Water levels in the Kenai River are near flood stage and water temperature is above average.
CFS at Soldotna Bridge was 14,600, Gauge Height was 9.48 ft on July 29. (Flood Stage is 12 ft)
CFS at Skilak Lake Outlet was 13,300, Gauge Height was 11.33 ft on July 29. (Flood Stage is 13 ft)
CFS at Cooper Landing was 5,840, Gauge Height was 10.27 ft on July 29. (Flood Stage is 13 ft)
Water Temperature was 57.6 degrees Fahrenheit (14.2 deg C) at the Soldotna Bridge on July 19.
Table 1. 2019 Inseason Summary Estimates for Kenai River Late-run Large Chinook Salmon

The Department switched to a large fish (≥34”) escapement goal for Kenai king salmon beginning with the 2017 season. Smaller king salmon are also important and contribute to the escapement, but our current ability to accurately apportion counts to all species in a timely manner is lacking. A fish length of ≥34” was chosen because fish in that size range are nearly all king salmon.
Footnotes
- Estimates and projections provided in the table are preliminary and will change as the season progresses. Each component is an estimate and has uncertainty associated with it.
- The size of distribution of king salmon is not constant over the run; larger kings typically become more abundant in the harvest and the run as the season progresses.
- The inseason estimated number of large kings in the ESSN harvest is likely biased. Post-season analysis is used to produce unbiased estimates.
- Genetic samples collected from the ESSN are NOT analyzed inseason
- Estimates of large Kenai kings in the ESSN harvest provided in the table are based on minimum, mean, and maximum annual estimates from prior years (2010-2018).
- ADF&G estimates that the harvest of king Salmon in the PU fishery will be negligible in 2019 since the harvest of kings in the PU fishery was closed by EO preseason.
This information was compiled based on raw and historical data for inseason management purposes.
Final data is subject to change.