Fish Count Data Search
|
Location: Situk River |
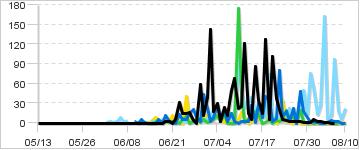
The selected years are color-coded in the graphs below:
|
Daily Counts
|
Cumulative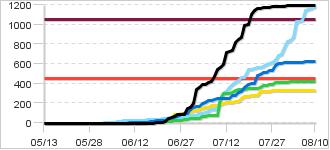
|
|
Description: The Situk River weir crew counts post-spawning downstream migrations of adult Steelhead beginning in spring (May-June) each year, and upstream pre-spawn salmon migrations beginning in summer (June-August). The weir is located on the lower river about 1 mile above the lower landing access point at Situk Lagoon. Travel time to the weir for fish from Situk Lagoon can be just a few hours depending on water velocity.
Biological Escapement Goal for Chinook in 2019:
450 - 1,050
(Graphed above)
|
|
|
Contact:
Area Management Biologist, | |
90 records returned for the years selected. Dashes indicate days with no count.
[Export results in Excel format or JSON format]
| Date 2020 |
Count 2020 |
Cumulative 2020 |
Cumulative 2019 |
Cumulative 2018 |
Cumulative 2017 |
Cumulative 2016 |
Notes for 2020 |
|---|---|---|---|---|---|---|---|
| Aug-10 | - | 1,196 | 623 | 420 | 1,187 | 329 | |
| Aug-09 | - | 1,196 | 623 | 420 | 1,165 | 328 | |
| Aug-08 | - | 1,196 | 623 | 420 | 1,159 | 328 | |
| Aug-07 | 0 | 1,196 | 621 | 420 | 1,142 | 328 | Weir Removed |
| Aug-06 | 0 | 1,196 | 619 | 420 | 1,045 | 328 | Panels Under Water |
| Aug-05 | 1 | 1,196 | 615 | 419 | 1,033 | 328 | Panels Under Water |
| Aug-04 | 1 | 1,195 | 614 | 418 | 1,028 | 328 | Panels Under Water; Estimated Counts |
| Aug-03 | 2 | 1,194 | 614 | 417 | 865 | 328 | Panels Under Water; Estimated Counts |
| Aug-02 | 2 | 1,192 | 614 | 417 | 839 | 326 | Panels Under Water; Estimated Counts |
| Aug-01 | 5 | 1,190 | 613 | 416 | 826 | 326 | |
| Jul-31 | 1 | 1,185 | 611 | 416 | 772 | 326 | |
| Jul-30 | 1 | 1,184 | 610 | 415 | 696 | 326 | |
| Jul-29 | 1 | 1,183 | 601 | 415 | 682 | 326 | Fish Tight 1330; Estimated Counts |
| Jul-28 | 2 | 1,182 | 584 | 412 | 633 | 326 | Panels Under Water/Pickets Pulled; Estimated Counts |
| Jul-27 | 2 | 1,180 | 536 | 393 | 615 | 326 | Panels Under Water/Pickets Pulled; Estimated Counts |
| Jul-26 | 3 | 1,178 | 536 | 392 | 603 | 320 | Panels Under Water/Pickets Pulled; Estimated Counts |
| Jul-25 | 2 | 1,175 | 514 | 382 | 593 | 320 | |
| Jul-24 | 4 | 1,173 | 512 | 377 | 571 | 319 | |
| Jul-23 | 6 | 1,169 | 494 | 358 | 569 | 318 | |
| Jul-22 | 21 | 1,163 | 484 | 353 | 562 | 283 | Fish Tight 1200; Estimated Counts |
| Jul-21 | 38 | 1,142 | 404 | 350 | 552 | 281 | Panels Under Water; Estimated Counts |
| Jul-20 | 102 | 1,104 | 397 | 346 | 546 | 281 | Panels Under Water |
| Jul-19 | 6 | 1,002 | 394 | 346 | 540 | 271 | |
| Jul-18 | 127 | 996 | 360 | 341 | 466 | 266 | |
| Jul-17 | 15 | 869 | 319 | 340 | 458 | 253 | |
| Jul-16 | 35 | 854 | 310 | 340 | 431 | 223 | |
| Jul-15 | 86 | 819 | 281 | 327 | 410 | 216 | |
| Jul-14 | 6 | 733 | 280 | 310 | 396 | 212 | |
| Jul-13 | 15 | 727 | 253 | 303 | 357 | 209 | |
| Jul-12 | 121 | 712 | 251 | 298 | 321 | 209 | |
| Jul-11 | 25 | 591 | 249 | 297 | 298 | 201 | |
| Jul-10 | 22 | 566 | 246 | 252 | 251 | 185 | |
| Jul-09 | 68 | 544 | 246 | 77 | 151 | 179 | |
| Jul-08 | 49 | 476 | 243 | 77 | 141 | 178 | |
| Jul-07 | 11 | 427 | 228 | 77 | 136 | 178 | |
| Jul-06 | 24 | 416 | 226 | 77 | 120 | 157 | |
| Jul-05 | 3 | 392 | 208 | 64 | 107 | 156 | |
| Jul-04 | 29 | 389 | 199 | 62 | 101 | 147 | |
| Jul-03 | 17 | 360 | 172 | 50 | 101 | 139 | |
| Jul-02 | 142 | 343 | 164 | 45 | 80 | 129 | |
| Jul-01 | 39 | 201 | 161 | 42 | 73 | 123 | |
| Jun-30 | 12 | 162 | 139 | 41 | 66 | 111 | |
| Jun-29 | 59 | 150 | 95 | 36 | 63 | 106 | |
| Jun-28 | 0 | 91 | 93 | 35 | 57 | 99 | |
| Jun-27 | 4 | 91 | 85 | 29 | 53 | 95 | |
| Jun-26 | 16 | 87 | 65 | 26 | 52 | 89 | |
| Jun-25 | 15 | 71 | 51 | 26 | 50 | 88 | |
| Jun-24 | 14 | 56 | 46 | 16 | 48 | 48 | |
| Jun-23 | 31 | 42 | 41 | 11 | 45 | 48 | |
| Jun-22 | 6 | 11 | 28 | 11 | 44 | 44 | |
| Jun-21 | 0 | 5 | 28 | 10 | 43 | 40 | |
| Jun-20 | 2 | 5 | 27 | 8 | 39 | 28 | |
| Jun-19 | 3 | 3 | 25 | 7 | 39 | 25 | |
| Jun-18 | 0 | 0 | 13 | 5 | 38 | 20 | |
| Jun-17 | 0 | 0 | 13 | 3 | 32 | 18 | |
| Jun-16 | 0 | 0 | 8 | 1 | 31 | 12 | |
| Jun-15 | 0 | 0 | 8 | 0 | 30 | 3 | |
| Jun-14 | 0 | 0 | 8 | 0 | 26 | 1 | |
| Jun-13 | 0 | 0 | 8 | 0 | 26 | 0 | |
| Jun-12 | 0 | 0 | 7 | 0 | 25 | 0 | |
| Jun-11 | 0 | 0 | 2 | 0 | 21 | 0 | |
| Jun-10 | 0 | 0 | 2 | 0 | 21 | 0 | |
| Jun-09 | 0 | 0 | 0 | 0 | 21 | 0 | |
| Jun-08 | 0 | 0 | 0 | 0 | 21 | 0 | |
| Jun-07 | 0 | 0 | 0 | 0 | 17 | 0 | |
| Jun-06 | 0 | 0 | 0 | 0 | 16 | 0 | |
| Jun-05 | 0 | 0 | 0 | 0 | 7 | 0 | |
| Jun-04 | 0 | 0 | 0 | 0 | 4 | 0 | |
| Jun-03 | 0 | 0 | 0 | 0 | 3 | 0 | |
| Jun-02 | 0 | 0 | 0 | 0 | 1 | 0 | |
| Jun-01 | 0 | 0 | 0 | 0 | 0 | 0 | |
| May-31 | 0 | 0 | 0 | 0 | 0 | 0 | |
| May-30 | 0 | 0 | 0 | 0 | 0 | 0 | |
| May-29 | 0 | 0 | 0 | 0 | 0 | 0 | |
| May-28 | 0 | 0 | 0 | 0 | 0 | 0 | |
| May-27 | 0 | 0 | 0 | 0 | 0 | 0 | |
| May-26 | 0 | 0 | 0 | 0 | 0 | 0 | |
| May-25 | 0 | 0 | 0 | 0 | 0 | 0 | |
| May-24 | 0 | 0 | 0 | 0 | 0 | 0 | |
| May-23 | 0 | 0 | 0 | 0 | 0 | 0 | |
| May-22 | 0 | 0 | 0 | 0 | 0 | 0 | |
| May-21 | 0 | 0 | 0 | 0 | 0 | 0 | |
| May-20 | 0 | 0 | 0 | 0 | 0 | 0 | |
| May-19 | 0 | 0 | 0 | 0 | 0 | 0 | |
| May-18 | 0 | 0 | 0 | 0 | 0 | 0 | |
| May-17 | 0 | 0 | 0 | 0 | 0 | 0 | |
| May-16 | 0 | 0 | 0 | 0 | 0 | 0 | |
| May-15 | 0 | 0 | 0 | 0 | 0 | 0 | |
| May-14 | 0 | 0 | 0 | 0 | 0 | 0 | |
| May-13 | 0 | 0 | 0 | 0 | 0 | 0 |