Fish Count Data Search
|
Location: Jim Creek |
The selected years are color-coded in the graphs below:
|
Daily Counts

* graphs are images and may be cached by browser |
Cumulative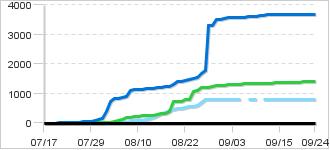
|
|
Description: Jim Creek weir is located about 1 mile upstream of the mouth area. The sustainable escapement goal for coho salmon is based on a post season foot survey of the McRoberts Creek tributary. The foot survey based escapement goal is not comparable to the weir count.
|
|
|
Contact:
Assistant Area Management Biologist, |
|
70 records returned for the years selected. Dashes indicate days with no count.
[Export results in Excel format or JSON format]
| Date 2026 |
Count 2026 |
Cumulative 2026 |
Cumulative 2025 |
Cumulative 2024 |
Cumulative 2023 |
Cumulative 2022 |
Notes for 2026 |
|---|---|---|---|---|---|---|---|
| 09/24 | - | 0 | 3,684 | 1,392 | 791 | 0 | |
| 09/23 | - | 0 | 3,684 | 1,392 | 791 | 0 | |
| 09/22 | - | 0 | 3,684 | 1,392 | 791 | 0 | |
| 09/21 | - | 0 | 3,684 | 1,392 | 791 | 0 | |
| 09/20 | - | 0 | 3,684 | 1,386 | 791 | 0 | |
| 09/19 | - | 0 | 3,684 | 1,383 | 791 | 0 | |
| 09/18 | - | 0 | 3,684 | 1,382 | 791 | 0 | |
| 09/17 | - | 0 | 3,684 | 1,382 | 791 | 0 | |
| 09/16 | - | 0 | 3,681 | 1,381 | 791 | 0 | |
| 09/15 | - | 0 | 3,681 | 1,381 | 791 | 0 | |
| 09/14 | - | 0 | 3,674 | 1,359 | 791 | 0 | |
| 09/13 | - | 0 | 3,674 | 1,348 | 791 | 0 | |
| 09/12 | - | 0 | 3,663 | 1,340 | 791 | 0 | |
| 09/11 | - | 0 | 3,643 | 1,340 | 791 | 0 | |
| 09/10 | - | 0 | 3,641 | 1,340 | - | 0 | |
| 09/09 | - | 0 | 3,621 | 1,339 | 791 | 0 | |
| 09/08 | - | 0 | 3,621 | 1,339 | 791 | 0 | |
| 09/07 | - | 0 | 3,618 | 1,339 | 791 | 0 | |
| 09/06 | - | 0 | 3,585 | 1,339 | - | 0 | |
| 09/05 | - | 0 | 3,573 | 1,310 | 791 | 0 | |
| 09/04 | - | 0 | 3,573 | 1,309 | 791 | 0 | |
| 09/03 | - | 0 | 3,571 | 1,294 | 791 | 0 | |
| 09/02 | - | 0 | 3,568 | 1,290 | 791 | 0 | |
| 09/01 | - | 0 | 3,548 | 1,271 | 791 | 0 | |
| 08/31 | - | 0 | 3,525 | 1,270 | 791 | 0 | |
| 08/30 | - | 0 | 3,503 | 1,264 | 791 | 0 | |
| 08/29 | - | 0 | 3,322 | 1,250 | 791 | 0 | |
| 08/28 | - | 0 | 3,293 | 1,208 | 791 | 0 | |
| 08/27 | - | 0 | 1,786 | 1,205 | 790 | 0 | |
| 08/26 | - | 0 | 1,671 | 1,198 | 690 | 0 | |
| 08/25 | - | 0 | 1,537 | 1,105 | 584 | 0 | |
| 08/24 | - | 0 | 1,504 | 1,052 | 570 | 0 | |
| 08/23 | - | 0 | 1,464 | 788 | 569 | 0 | |
| 08/22 | - | 0 | 1,443 | 787 | 523 | 0 | |
| 08/21 | - | 0 | 1,411 | 727 | 497 | 0 | |
| 08/20 | - | 0 | 1,401 | 727 | 493 | 0 | |
| 08/19 | - | 0 | 1,302 | 717 | 473 | 0 | |
| 08/18 | - | 0 | 1,247 | 404 | 425 | 0 | |
| 08/17 | - | 0 | 1,237 | 332 | 372 | 0 | |
| 08/16 | - | 0 | 1,219 | 331 | 325 | 0 | |
| 08/15 | - | 0 | 1,187 | 289 | 242 | 0 | |
| 08/14 | - | 0 | 1,182 | 263 | 202 | 0 | |
| 08/13 | - | 0 | 1,181 | 253 | 142 | 0 | |
| 08/12 | - | 0 | 1,165 | 245 | 131 | 0 | |
| 08/11 | - | 0 | 1,149 | 240 | 94 | 0 | |
| 08/10 | - | 0 | 1,124 | 237 | 79 | 0 | |
| 08/09 | - | 0 | 1,120 | 220 | 79 | 0 | |
| 08/08 | - | 0 | 1,100 | 180 | 65 | 0 | |
| 08/07 | - | 0 | 913 | 170 | 32 | 0 | |
| 08/06 | - | 0 | 850 | 110 | 10 | 0 | |
| 08/05 | - | 0 | 843 | 74 | 3 | 0 | |
| 08/04 | - | 0 | 841 | 37 | 3 | 0 | |
| 08/03 | - | 0 | 732 | 25 | 1 | 0 | |
| 08/02 | - | 0 | 401 | 21 | 1 | 0 | |
| 08/01 | - | 0 | 155 | 18 | 0 | 0 | |
| 07/31 | - | 0 | 123 | 14 | 0 | 0 | |
| 07/30 | - | 0 | 94 | 14 | 0 | 0 | |
| 07/29 | - | 0 | 34 | 5 | 0 | 0 | |
| 07/28 | - | 0 | 34 | 5 | 0 | 0 | |
| 07/27 | - | 0 | 34 | 4 | 0 | 0 | |
| 07/26 | - | 0 | 31 | 3 | 0 | 0 | |
| 07/25 | - | 0 | 15 | 0 | 0 | 0 | |
| 07/24 | - | 0 | 12 | 0 | - | 0 | |
| 07/23 | - | 0 | 12 | 0 | 0 | 0 | |
| 07/22 | - | 0 | 9 | 0 | 0 | 0 | |
| 07/21 | - | 0 | 5 | 0 | 0 | 0 | |
| 07/20 | - | 0 | 0 | 0 | 0 | 0 | |
| 07/19 | - | 0 | 0 | 0 | 0 | 0 | |
| 07/18 | - | 0 | 0 | 0 | 0 | 0 | |
| 07/17 | - | 0 | 0 | 0 | 0 | 0 |