Fish Count Data Search
|
Location: Chena River |
The selected years are color-coded in the graphs below:
|
Daily Counts
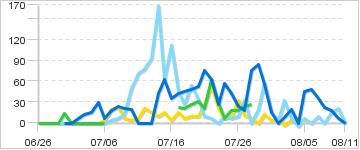
* graphs are images and may be cached by browser |
Cumulative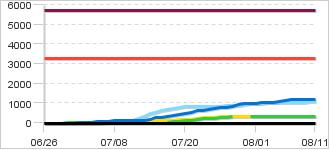
|
|
Description: The Chena Dam, 45 river miles upstream from the confluence with the Tanana, is used as the counting tower. On average, it takes a salmon 1.5 to 2 days to reach the dam from the mouth. The Chena River salmon fishery is from the mouth to 100 yds downstream from the dam.
Biological Escapement Goal for Chinook:
3,300 - 5,700
(Graphed above)
|
|
|
Contact:
Interior Sport Fish Research Biologist, | |
47 records returned for the years selected. Dashes indicate days with no count.
[Export results in Excel format or JSON format]
| Date 2026 |
Count 2026 |
Cumulative 2026 |
Cumulative 2025 |
Cumulative 2024 |
Cumulative 2023 |
Cumulative 2022 |
Notes for 2026 |
|---|---|---|---|---|---|---|---|
| 08/11 | - | 0 | 1,219 | 322 | 1,069 | 355 | |
| 08/10 | - | 0 | 1,219 | 322 | 1,069 | 355 | |
| 08/09 | - | 0 | 1,212 | 322 | 1,048 | 355 | |
| 08/08 | - | 0 | 1,194 | 322 | 1,033 | 355 | |
| 08/07 | - | 0 | 1,171 | 322 | 1,033 | 355 | |
| 08/06 | - | 0 | 1,135 | 322 | 1,024 | 355 | |
| 08/05 | - | 0 | 1,087 | 322 | 1,024 | 355 | |
| 08/04 | - | 0 | 1,042 | 322 | 1,018 | 355 | |
| 08/03 | - | 0 | 1,042 | 322 | 1,023 | 349 | |
| 08/02 | - | 0 | 1,023 | 322 | 1,016 | 346 | |
| 08/01 | - | 0 | 1,015 | 322 | 983 | 349 | |
| 07/31 | - | 0 | 1,015 | 322 | 980 | 344 | |
| 07/30 | - | 0 | 1,000 | - | 965 | 341 | |
| 07/29 | - | 0 | 945 | - | 906 | 329 | |
| 07/28 | - | 0 | 861 | 322 | 886 | 329 | |
| 07/27 | - | 0 | 786 | 295 | 886 | 323 | |
| 07/26 | - | 0 | 768 | 271 | 854 | 312 | |
| 07/25 | - | 0 | 744 | 253 | 845 | 280 | |
| 07/24 | - | 0 | 702 | 235 | 839 | 271 | |
| 07/23 | - | 0 | 645 | 229 | 830 | 265 | |
| 07/22 | - | 0 | 618 | 199 | 830 | 244 | |
| 07/21 | - | 0 | 555 | 136 | 824 | 190 | |
| 07/20 | - | 0 | 480 | 115 | 815 | 163 | |
| 07/19 | - | 0 | 427 | 84 | 781 | 154 | |
| 07/18 | - | 0 | 379 | 57 | 727 | 145 | |
| 07/17 | - | 0 | 333 | 36 | 700 | 139 | |
| 07/16 | - | 0 | 291 | - | 655 | 124 | |
| 07/15 | - | 0 | 255 | - | 544 | 121 | |
| 07/14 | - | 0 | 192 | - | 481 | 106 | |
| 07/13 | - | 0 | 150 | - | 313 | 97 | |
| 07/12 | - | 0 | 150 | - | 220 | 82 | |
| 07/11 | - | 0 | 150 | - | 143 | 61 | |
| 07/10 | - | 0 | 150 | - | 71 | 55 | |
| 07/09 | - | 0 | 131 | - | 21 | 52 | |
| 07/08 | - | 0 | 110 | - | 9 | 46 | |
| 07/07 | - | 0 | 86 | - | 3 | 22 | |
| 07/06 | - | 0 | 68 | 14 | 0 | 3 | |
| 07/05 | - | 0 | 62 | 14 | 0 | 0 | |
| 07/04 | - | 0 | 33 | 14 | 0 | 0 | |
| 07/03 | - | 0 | 18 | 14 | 0 | 0 | |
| 07/02 | - | 0 | 6 | 14 | 0 | 0 | |
| 07/01 | - | 0 | 0 | 14 | 0 | 0 | |
| 06/30 | - | 0 | 0 | 14 | 0 | 0 | |
| 06/29 | - | 0 | 0 | 0 | 0 | 0 | |
| 06/28 | - | 0 | 0 | 0 | 0 | 0 | |
| 06/27 | - | 0 | 0 | 0 | 0 | 0 | |
| 06/26 | - | 0 | 0 | 0 | 0 | 0 |