Fish Count Data Search
|
Location: Deshka |
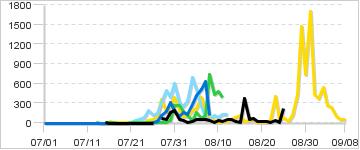
The selected years are color-coded in the graphs below:
|
Daily Counts
|
Cumulative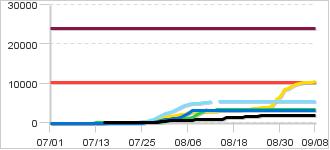
|
|
Description: Deshka:The Deshka weir is located at river mile 7. Escapement of king and coho salmon is monitored using a resistance board weir that operates from about May 20 through September 15. The Deshka is semi remote, entering the Susitna on its west side, opposite of the road system. It can be accessed by river boats launched at Deshka Landing near Willow or Susitna Landing at the mouth of Kashwitna River or by airplane. The expansive mouth area is popular for salmon fishing. The lower 7 miles of river is also popular, but only navigable by shallower running jet or air boats.
Sustainable Escapement Goal for Chinook in 2020:
9,000 - 18,000
|
|
|
Contact:
Area Management Biologist, |
|
70 records returned for the years selected. Dashes indicate days with no count.
[Export results in Excel format or JSON format]
| Date 2023 |
Count 2023 |
Cumulative 2023 |
Cumulative 2022 |
Cumulative 2021 |
Cumulative 2020 |
Cumulative 2019 |
Notes for 2023 |
|---|---|---|---|---|---|---|---|
| Sep-08 | - | 1,817 | 3,168 | 3,338 | 5,368 | 10,445 | |
| Sep-07 | - | 1,817 | 3,168 | 3,338 | 5,368 | 10,388 | |
| Sep-06 | - | 1,817 | 3,168 | 3,338 | 5,368 | 10,342 | |
| Sep-05 | - | 1,817 | 3,168 | 3,338 | 5,368 | 10,245 | |
| Sep-04 | - | 1,817 | 3,168 | 3,338 | 5,368 | 10,015 | |
| Sep-03 | - | 1,817 | 3,168 | 3,338 | 5,368 | 9,751 | |
| Sep-02 | - | 1,817 | 3,168 | 3,338 | 5,368 | 9,203 | |
| Sep-01 | - | 1,817 | 3,168 | 3,338 | 5,368 | 8,826 | |
| Aug-31 | - | 1,817 | 3,168 | 3,338 | 5,368 | 8,395 | |
| Aug-30 | - | 1,817 | 3,168 | 3,338 | 5,368 | 6,689 | Weir taken out by flood waters |
| Aug-29 | - | 1,817 | 3,168 | 3,338 | 5,368 | 5,946 | Weir flooded |
| Aug-28 | - | 1,817 | 3,168 | 3,338 | 5,368 | 4,468 | Weir flooded |
| Aug-27 | - | 1,817 | 3,168 | 3,338 | 5,368 | 4,038 | Weir flooded |
| Aug-26 | - | 1,817 | 3,168 | 3,338 | 5,368 | 3,918 | Weir flooded |
| Aug-25 | 226 | 1,817 | 3,168 | 3,338 | 5,368 | 3,888 | Water Level 2.5 |
| Aug-24 | 12 | 1,591 | 3,168 | 3,338 | 5,368 | 3,801 | Water level 2.09 |
| Aug-23 | 33 | 1,579 | 3,168 | 3,338 | 5,368 | 3,752 | Water level 2.11 |
| Aug-22 | 13 | 1,546 | 3,168 | 3,338 | 5,368 | 3,351 | Water level 2.17 |
| Aug-21 | 26 | 1,533 | 3,168 | 3,338 | 5,368 | 3,311 | Water Level 2.21 |
| Aug-20 | 23 | 1,507 | 3,168 | 3,338 | 5,368 | 3,307 | |
| Aug-19 | 18 | 1,484 | 3,168 | 3,338 | 5,368 | 3,294 | |
| Aug-18 | 63 | 1,466 | 3,168 | 3,338 | 5,368 | 3,291 | |
| Aug-17 | 58 | 1,403 | 3,168 | 3,338 | 5,368 | 3,245 | Water Level 2.45 |
| Aug-16 | 369 | 1,345 | 3,168 | 3,338 | 5,368 | 3,213 | Water Level 2.45 |
| Aug-15 | 11 | 976 | 3,168 | 3,338 | 5,368 | 3,195 | Water Level 2.28 |
| Aug-14 | 23 | 965 | 3,168 | 3,338 | 5,368 | 3,082 | |
| Aug-13 | 47 | 942 | 3,168 | 3,338 | - | 3,005 | |
| Aug-12 | 49 | 895 | 3,168 | - | 5,368 | 2,945 | water level 2.26 |
| Aug-11 | 16 | 846 | 3,168 | 3,338 | 5,241 | 2,927 | water level 2.2 |
| Aug-10 | 34 | 830 | 3,168 | 2,951 | 5,118 | 2,908 | Water Level 2.18 |
| Aug-09 | 12 | 796 | 3,168 | 2,471 | 5,040 | 2,904 | |
| Aug-08 | 41 | 784 | 3,168 | 2,030 | 4,933 | 2,871 | Water Level 2.22 |
| Aug-07 | 51 | 743 | 3,057 | 1,286 | 4,882 | 2,799 | Water Level 2.22 |
| Aug-06 | 48 | 692 | 2,423 | 1,171 | 4,792 | 2,660 | water level 2.24 |
| Aug-05 | 49 | 644 | 1,914 | 1,098 | 4,546 | 2,271 | water level 2.27; gauge adjusted |
| Aug-04 | 22 | 595 | 1,502 | 944 | 4,041 | 2,053 | water level 2.2 |
| Aug-03 | 9 | 573 | 1,218 | 902 | 3,346 | 1,856 | |
| Aug-02 | 32 | 564 | 1,086 | 788 | 3,015 | 1,763 | Water level 2.30 |
| Aug-01 | 48 | 532 | 925 | 613 | 2,769 | 1,668 | |
| Jul-31 | 185 | 484 | 823 | 342 | 2,456 | 1,479 | |
| Jul-30 | 164 | 299 | 637 | 78 | 1,851 | 1,093 | |
| Jul-29 | 61 | 135 | 329 | 47 | 1,459 | 832 | |
| Jul-28 | 69 | 74 | 153 | 39 | 957 | 653 | |
| Jul-27 | - | 5 | 31 | 36 | 648 | 292 | Weir Flooded |
| Jul-26 | 0 | 5 | 8 | 25 | 496 | 170 | Weir Flooded |
| Jul-25 | 0 | 5 | 0 | 16 | 375 | 114 | Weir flooded |
| Jul-24 | 0 | 5 | 0 | 13 | 182 | 78 | weir flooded |
| Jul-23 | 0 | 5 | 0 | 8 | 105 | 64 | weir flooded |
| Jul-22 | 0 | 5 | 0 | 7 | 52 | 63 | weir flooded |
| Jul-21 | 0 | 5 | 0 | 6 | 11 | 62 | weir flooded |
| Jul-20 | 0 | 5 | 0 | 3 | 3 | 58 | Weir flooded |
| Jul-19 | 0 | 5 | 0 | 3 | 3 | 52 | weir flooded |
| Jul-18 | 0 | 5 | 0 | 3 | 3 | 50 | Weir flooded |
| Jul-17 | 0 | 5 | 0 | 3 | 3 | 38 | Weir flooded |
| Jul-16 | 0 | 5 | 0 | 2 | 3 | 23 | Weir flooded |
| Jul-15 | 5 | 5 | 0 | 1 | 0 | 0 | |
| Jul-14 | - | - | 0 | 1 | 0 | 0 | |
| Jul-13 | - | - | 0 | 1 | 0 | 0 | |
| Jul-12 | - | - | 0 | 0 | 0 | 0 | |
| Jul-11 | - | - | 0 | 0 | 0 | 0 | |
| Jul-10 | - | - | 0 | 0 | 0 | 0 | |
| Jul-09 | - | - | 0 | 0 | 0 | 0 | |
| Jul-08 | - | - | 0 | 0 | 0 | 0 | |
| Jul-07 | - | - | 0 | 0 | 0 | 0 | |
| Jul-06 | - | - | 0 | 0 | 0 | 0 | |
| Jul-05 | - | - | 0 | 0 | 0 | 0 | |
| Jul-04 | - | - | 0 | 0 | 0 | 0 | |
| Jul-03 | - | - | 0 | 0 | 0 | 0 | |
| Jul-02 | - | - | 0 | 0 | 0 | 0 | |
| Jul-01 | - | - | 0 | 0 | 0 | 0 |